

Data has become one of the most valuable resources of the 21st century. Indeed, data can be considered the most important input when it comes to make informed decisions. The recent global pandemic crisis highlighted the vital role of data for reporting accurate case numbers and outbreaks, identifying the most vulnerable demographics, and understanding the most effective vaccines, to mention few. Data also plays a key role when it comes to sustainability. Data help business to make decisions that guide measurable and responsible practices; they give us the opportunity to better understand our demand for food, energy, water and land as the world population increases and changes in climate affects these resources; data can also support real-time monitoring of the environment, help consumers adopt more sustainable behavior, and create sustainable value chains.
A specific type of data that has gained importance and popularity among different user groups is satellite-based data. Satellite-based Earth Observation relies on the use of remote sensing techniques for collecting information on the physical, chemical, and biological systems of the planet Earth to monitor land, marine habitats as well as freshwater bodies such as (rivers, lakes, as well as groundwater) and atmosphere (EUSPA, 2021). EO data has become an invaluable resource for supporting decision-makers in all sectors of society, including responding to the UN Sustainable Development Goals (SDGs) and the Convention on Wetlands (Ramsar, 1971).
Technological advances and significant reductions in the costs of operation and maintenance of satellites together with free and open data policy has allowed the generation of a large amount of geospatial data that are freely available for a wide range of users - such as researchers, small businesses, NGOs, and society - to benefit from EO data (Christopherson et al., 2019). Every day, several exabytes of free and open geospatial data are generated, which means that everyday a huge amount of data from different sources, of different scales, with different variable types, and spatial and temporal resolutions must be collected, characterized, analyzed, stored, and disseminated (Guo et al., 2015; Gomes et al., 2020). For instance, Landsat-7 and Landsat-8, Sentinel-1, -2 and -3, and MODIS (Terra and Aqua units) produced about 5 petabytes of open data in 2019 (Soille et al., 2018). These big data sets often exceed the memory, storage and processing capacities of personal computers which limits users to take full advantage of the amount of data that is available for use (Gomes et al., 2020).
To overcome those challenges, new approaches and solutions have been developed to properly store, process, disseminate and analyze satellite imagery. In this context, Earth Observation Data Cubes stand out for storing and transferring large quantities of Earth observation imagery, facilitating data organization and management, and allowing pre-processing and fast access to summarized data (Kopp et al., 2019), (Copernicus, 2021). The world’s first EO data cube, The Australian Geoscience Data Cube (AGDC), was developed in 1979 in the context of the countries’ first participation in the Landsat program (Lewis et al, 2017). Several other initiatives and projects have been deployed since then to support national and regional policies in decision-making (e.g.: Swiss Data Cube, DE Africa) and to foster the use and impact of satellite data (e.g.: Open Data Cube).
What are Data Cubes?
A data cube is a multidimensional data infrastructure used to store data. It represents the data in terms of dimensions and measures: each dimension corresponds to an attribute or a set of attributes, and each cell stores the value of some aggregate measure such as count or sum (Han et al., 2012). Figure 2 presents the diagram of a general data cube.
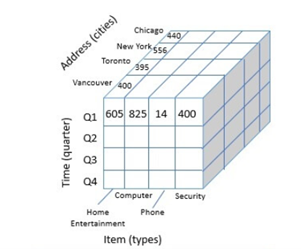
(Vancouver, Toronto, New York, Chicago),
item type (home entertainment, computer,
phone, security), and time (Q1, Q2, Q3, Q4). Source: Neha T., 2020.
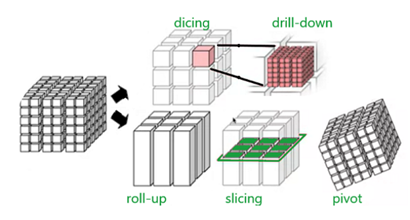
The data cube in Figure 2 stores sales information on a multinational corporation, such as sales in all time, sales at all branches, sales at all locations, sales of all items. Besides storing data, users can also manipulate a cube to select specific data for the purpose of analysis or to visualize data from a different perspective. Figure 3 and Table 1 presents the 5 main data cube operations using a simple example use case for ease of understanding.

When it comes to geospatial data, data cubes can store a large amount of satellite data and are specialized on a region or a thematic application over a specified period. Earth Observation data cubes (EODC) store data that has been processed to serve a specific set of requirements and organized into a form that allows immediate analysis with a small additional user effort and interoperability both, through time and with other datasets (CEOS, n.d.). Earth Observation data pre-processed for users and ‘ready to use’ is called Analysis Ready Data (ARD). General data pre-processing includes atmospheric correction, cloud masking, orthorectification of images and re-gridding (EUMETSAT, 2022).
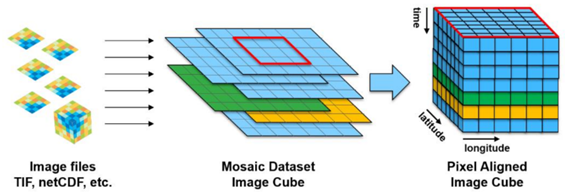
The two main dimensions of a EODC are latitude and longitude; other typical dimensions include: time, depth and altitude. Over a specific area, images are mosaicked together and then these mosaics are stacked on top of each other (Stefan Brand, 2021), see Figure 4. This way, the user receives a continuous, gridded data structure with at least three dimensions (latitude, longitude and time).
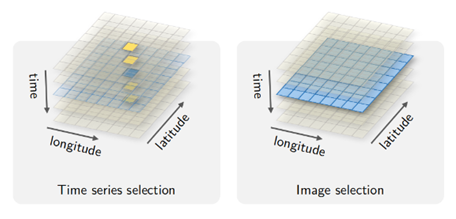
A point-in-time query for an EO data cube, or a slicing operation, returns an image as shown in Figure 5 (image selection). This operation can be used to compare attributes of different regions at the same period. In turn, a query for a cube at a particular location, or a rolling-up operation, returns a time series of values at that location (Figure 5 – time series selection). The cube structure simplifies data aggregation operations such as weekly, monthly, and annual analysis (Koop et. al., 2019). Dicing and drill-down operations can be useful to analyze precipitation data on basins and the many levels of subbasins, for instance. Overall, users can inspect changes to any area over any timespan covered by the ingested datasets. (Open-source) algorithms are then applied, allowing for analysis of particular data – including on vegetation, land use, water coverage and quality, and urban expansion (ITU Hub, 2020).
Several countries have been implementing EO data cubes to support national policy and decision-making. Data cubes are also being deployed at regional scales, which allows addressing transboundary issues relevant to regional policy and planning needs (Dhu et al, 2019). Examples of regional and national open data cubes (ODC) already implemented and/or under development are shown in Table 2.
| Name | Scale |
|---|---|
| Brazil Data Cube | National |
| Colombian Data Cube | National |
| Digital Earth Australia | National |
| Digital Earth Africa | Regional |
| Mexican Data Cube | National |
| Middle East and North Africa (MENA) Analysis Ready Data Cube (ARDC) | Regional |
| Swiss Data Cube | National |
| Uganda DFMS | National |
Earth Observation data cube applications for water resource management
Some of the most requested Earth observation datasets are for water resource management applications (ITU Hub, 2020). Data Cubes can help solve water issues including monitoring ecosystem degradation over vast areas and long-time periods (by using time series) with data including water extent, water detection, water quality, coastal change and water detection using radar. Table 3 presents the main applications available to users to date.
| Baseline Data | Use | Application | Region | Provider |
|---|---|---|---|---|
| Landsat |
Defines polygon boundaries around significant water areas. |
Find water across the country. |
Australia | |
| Landsat |
Historical surface water observations to map changes in water extent. |
Understand the location and movement of inland and coastal water. Monitor changes in water availability over time. Analysis into flood risk assessment. Observing the effect of major weather on a water system. |
Africa Switzerland Colombia |
|
| Landsat |
Characterize wetland behavior. Compare current and historic wetland dynamics. |
Monitor changes to the amount of water, green vegetation, dry vegetation, and bare soil. | Queensland wetlands since 1987 | Australian Geoscience Data Cube |
| Landsat |
Map the typical location coastline at mean sea level. |
Model how coastlines respond to drivers of change, including extreme weather events, sea level rise and urban development. | Australian coastline | Australian Geoscience Data Cube |
| Landsat |
Map intertidal zone in 3D, providing 25 m resolution elevation data on sandy beaches, tidal flats, rocky shores, and reefs. |
Model sea level rise. Plan for extreme events such as storm surges and coastal flooding. |
Australian coastline | Australian Geoscience Data Cube |
| Landsat |
Cloud-free imagery mosaics of coastline zones, filtering the data to focus only on images taken at certain tidal conditions. |
Monitor costal erosion Monitor how coastal erosion and sea level rise affects intertidal organisms. Identify and minimize the impacts of coastal change and erosion. |
Australia Africa |
Australian Geoscience Data Cube |
| Landsat | 25 m resolution annual maps of canopies (classified into three classes according to the greenness of satellite image pixels). |
Monitor changes in the extent and canopy density of mangroves since 1987. |
Australian coastline | Australian Geoscience Data Cube |
| Sentinel 2 |
Snow Cover Map. |
Identify different areas ranging from no snow cover to permanent snow cover during the period April-August 2017. |
Switzerland | Swiss Data Cube |
| Sentinel 2 |
Measure the normalized difference chlorophyll index (NDCI). |
Monitor chlorophyll-a. Monitor water quality. |
Africa | DE Africa |
| Sentinel 2 |
Measure the change in mangroves extents using NDVI (reflectance) values. |
Monitor the change of the coastline and the impact of humans and a changing climate on coastal ecosystems. Identify indicators of erosion and change in extent of mangroves. |
Africa |
Conclusion
A significant growth in open and free land imagery data has significantly increased data volumes in the past years. Data cubes emerge as a valuable approach to expand the use of satellite data. They allow the storage of large amount of pre-processed data in a simple way, reduce data preparation burden, increase data interoperability, provide a summarized view of data as well as quick and better analysis. Overall, cubes help improving the performance of data analysis, which increases the user’s capacity to explore the multiple benefits of Earth observation data. However, lack of knowledge and skills, infrastructure, and resources to access and explore the potential of the available space-based data remains a challenge for most developing countries. Therefore, together with the development of open data cubes there should also exist an effort to develop training material along with the products, services, and databases to enable users to develop the skills needed to use them. For instance, DE Africa offers an online training to help users work autonomously on the platform.
When it comes to water resources management, several products and resources (maps, mosaics, models, algorithms, notebooks) with important applications have been developed. However, few regions in the world are already benefiting from those products. It is expected that the further development of open data cubes will contribute to close this gap.

Camara, G., Simoes, R., Souza, F., Peletier, C., Sanchez, A., Andrade, P. R., Ferreira, K., & Queiroz, G. (n.d.-a). Chapter 2 earth observation data cubes | sits: Satellite image time series analysis on earth observation data cubes. Retrieved July 7, 2022, from https://e-sensing.github.io/sitsbook/earth-observation-data-cubes.html.
CEOS. (n.d.). CEOS Analysis Ready Data. Commitee on Earth Observation Satellites; CEOS. https://ceos.org/ard/
Christopherson, J.B., Ramaseri Chandra, S.N., and Quanbeck, J.Q. (2019). 2019 Joint Agency Commercial Imagery Evaluation—Land remote sensing satellite compendium: U.S. Geological Survey Circular 1455, 191 p., https://doi.org/10.3133/cir1455.
Copernicus. (2021, October 14). Observer: Data cubes: Enabling and facilitating earth observation applications | copernicus. Copernicus - Europe’s Eyes on Earth; European Union. https://www.copernicus.eu/en/news/news/observer-data-cubes-enabling-and….
EUMETSAT. (2022, February 4). Analysis Ready Data with the Atmospheric Composition Data Cube. EUMETSAT; EUMETSAT. https://www.eumetsat.int/analysis-ready-data-atmospheric-composition-da….
European Space Agency. (2021, November 15). Euro Data Cube has changed the way people process Earth observation data. EO Science for Society. https://eo4society.esa.int/2021/11/15/euro-data-cube-has-changed-the-wa…
EUSPA. (2021, May 4). What is Earth Observation? EUSPA; European Union Agency for the Space Programme. https://www.euspa.europa.eu/european-space/eu-space-programme/what-eart….
Geeks for Geeks. (2021, August 1). Data cube or OLAP approach in Data Mining. GeeksforGeeks. https://www.geeksforgeeks.org/data-cube-or-olap-approach-in-data-mining/.
Gomes, V. C. F., Queiroz, G. R., & Ferreira, K. R. (2020). An overview of platforms for big earth observation data management and analysis. Remote Sensing, 12(8), 1253. https://doi.org/10.3390/rs12081253.
Guo, H.-D., Zhang, L., & Zhu, L.-W. (2015). Earth observation big data for climate change research. Advances in Climate Change Research, 6(2), 108–117. https://doi.org/10.1016/j.accre.2015.09.007.
Han, J., Kamber, M., & Pei, J. (2012). Introduction. In Data Mining (pp. 1–38). Elsevier. https://doi.org/10.1016/B978-0-12-381479-1.00001-0.
ITU Hub. (2020, May 7). Water and the Data Cube Revolution: Analysis-ready satellite data for better decisions. ITU Hub. https://www.itu.int/hub/2020/05/water-and-the-data-cube-revolution-anal…
Kopp, S., Becker, P., Doshi, A., Wright, D. J., Zhang, K., & Xu, H. (2019). Achieving the full vision of earth observation data cubes. Data, 4(3), 94. https://doi.org/10.3390/data4030094.
Lewis, A., Oliver, S., Lymburner, L., Evans, B., Wyborn, L, et al. (2017). ‘The Australian Geoscience Data Cube-Foundations and lessons learned’. Remote Sensing of Environment, 2020, 276-292, http://dx.doi.org/10.1016/j.rse.2017.03.015.
Neha T. (2020, September 29). Data cube. Binary Terms. https://binaryterms.com/data-cube.html.
Soille, P., Burger, A., De Marchi, D., Kempeneers, P., Rodriguez, D., Syrris, V., & Vasilev, V. (2018). A versatile data-intensive computing platform for information retrieval from big geospatial data. Future Generation Computer Systems, 81, 30–40. https://doi.org/10.1016/j.future.2017.11.007.
Stefan Brand. (2021, January 26). Earth observation data cubes as a service. EOX. https://eox.at/2021/01/earth-observation-data-cubes-as-a-service/.
UN-SPIDER. (n.d.). Data Application of the Month: Earth Observation Data Cubes. UN-SPIDER. Retrieved August 7, 2022, from https://www.un-spider.org/links-and-resources/daotm-data-cubes.