SDG 1 - No Poverty

SDG 1

End poverty in all its forms everywhere

While global poverty rates have been cut by more than half since 2000, one in ten people in developing regions are still living with their families on less than the international poverty line of US$1.90 a day, and there are millions more who make little more than this daily amount. Significant progress has been made in many countries within Eastern and Southeastern Asia, but up to 42% of the population in Sub-Saharan Africa continues to live below the poverty line.

Poverty is more than the lack of income and resources to ensure a sustainable livelihood. Its manifestations include hunger and malnutrition, limited access to education and other basic services, social discrimination and exclusion as well as the lack of participation in decision-making.

Economic growth must be inclusive to provide sustainable jobs and promote equality. Social protection systems need to be implemented to help alleviate the suffering of disaster-prone countries and provide support in the face of great economic risks. These systems will help strengthen responses by afflicted populations to unexpected economic losses during disasters and will eventually help to end extreme poverty in the most impoverished areas.

Facts and Figures

  • 783 million people live below the international poverty line of US$1.90 a day
  • In 2016, almost 10 per cent of the world’s workers live with their families on less than US$1.90 per person per day
  • Globally, there are 122 women aged 25 to 34 living in extreme poverty for every 100 men of the same age group.
  • Most people living below the poverty line belong to two regions: Southern Asia and sub-Saharan Africa
  • High poverty rates are often found in small, fragile and conflict-affected countries
  • One in four children under age five in the world has inadequate height for his or her age
  • As of 2016, only 45% of the world’s population were effectively covered by at least one social protection cash benefit.
  • In 2017, economic losses due to disasters, including three major hurricanes in the USA and the Caribbean, were estimated at over $300 billion.

Space-based Technologies for SDG 1

Climate-related extreme events and other disasters can plunge communities into poverty. Space-based technologies can contribute to all phases of the disaster management cycle, including prevention, preparedness, early warning, response and reconstruction. Space-based technologies can contribute to all phases of the disaster management cycle, including prevention, preparedness, early warning, response and reconstruction. UNOOSA helps vulnerable communities access space technology to build their resilience and reduce their exposure and vulnerability to environmental shocks and disasters. Read more here.

SDG 1 Targets

Learn more about the SDGs

Related Content

Article

Can space technologies help improve WASH provision in camps and informal settlements?

The Human Right to water and sanitation

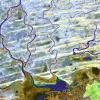
What does your morning routine look like? For most readers I’d assume you use the toilet, wash your hands, and maybe take a shower.  However, do you ever stop to consider the water you use to shower, or the soap you use to wash your hands? Often, especially in developed countries, these things are taken for granted, rightly considering access to adequate water, sanitation, and hygiene (WASH) as basic Human Rights (Figure 1).

Наводнения в Судане - Космический мониторинг наводнений для управления рисками стихийных бедствий

Translated by Marina Agarkova

В 2019 году наводнения стали причиной 43,5% всех смертей в результате стихийных бедствий и, таким образом, представляют собой самый смертоносный тип бедствия с растущим числом событий по сравнению с предыдущими годами (CRED, 2019). Кроме того, наводнения приводят к наибольшему числу пострадавших людей по сравнению с другими бедствиями, поскольку они влияют на деятельность человека и экономику (CRED, 2019; Elagib et al. 2019).

Est ce que les Technologies Spatiales Peuvent Améliorer les Provisions WASH dans les Camps et Quartiers Informels

Le droit humain à l'eau et à l'assainissement 

À quoi ressemble votre routine matinale ? Pour la plupart des lecteurs, je suppose que vous utilisez les toilettes, vous vous lavez les mains et peut-être que vous prenez une douche. Cependant, vous arrive-t-il de vous arrêter pour réfléchir à l'eau que vous utilisez sous la douche ou au savon que vous utilisez pour vous laver les mains ?

Interview with Margherita Bruscolini, Geospatial & Earth Scientist, Drone Pilot at RSS-Hydro

Margherita is an interdisciplinary Earth scientist and drone pilot with a background in geologic and environmental sciences. She has international experience working in fields such as Earth Observation (EO), remote sensing, drones & geospatial data analysis applied to the environmental and humanitarian sectors, sustainability and climate change. Margherita is passionate about natural and climate-related technologies that can be used to develop sustainable and long-lasting solutions. She is working for a more inclusive world (Women in Geospatial+), without any sort of geographical or social barriers. Keywords: Science communication, Climate Change, STEM, inclusivity, sustainability, nature, hydrosphere, hydrology, water risks, Earth Observation (EO), satellite data, flood modeling, vulnerability, resilience, lifelong learning  Region/Country mentioned: Temperate climates, Arid climates, Luxembourg, Niger  Relevant SDG targets: 1, 4, 6, 9, 11, 13, 17  

Event

Local Perspectives Case Studies

Project / Mission / Initiative / Community Portal

Space-Enabled Modeling of the Niger River to Enhance Regional Water Resources Management

River and floodplain landscapes are constantly undergoing change due to natural and manmade processes putting pressure on fluvial systems, such as reservoirs, intensive agriculture, high-impact repetitive droughts and floods and the overall effects of climate change. All these bring about considerable changes, some of which irreversibly degrade ecosystem services, local economies and impact lives, particularly in sensitive transitional zones such as the Sahel region in Africa and its Niger River Basin (NRB).

In-Service ICT Training for Environmental Professionals

Decision-makers are faced with the constant challenge of maintaining access to and understanding new technologies and data, as information and communication technologies (ICTs) are constantly evolving and as more and more data is becoming available. Despite continually improving technologies, informed decision-making is being hindered by inadequate attention to enabling conditions, e.g. a lack of in-service education and professional training for decision-makers.

Stakeholder

Remote Sensing, GIS and Climatic Research Lab, University of the Punjab

The emerging demand of GIS and Space Applications for Climate Change studies for the socio-economic development of Pakistan along with Government of Pakistan Vision 2025, Space Vision 2047 of National Space Agency of Pakistan, and achievement of UN Sustainable Development Goals (SDGs) impelled the Higher Education Commission of Pakistan (HEC) to establish Remote Sensing, GIS and Climatic Research Lab (RSGCRL) at University of the Punjab, Lahore, Pakistan.

The United Nations University Institute on Comparative Regional Integration Studies (UNU-CRIS)

The United Nations University Institute on Comparative Regional Integration Studies (UNU-CRIS) is a research and training institute of the United Nations University. UNU is a global network of institutes and programs engaged in research and capacity development to support the universal goals of the UN. It brings together leading scholars from around the world with a view to generate strong and innovative knowledge on how to tackle pressing global problems. UNU-CRIS focuses on the study of processes of global cooperation and regional integration and their implications.

Software/Tool/(Web-)App

mWater

mWater is an operating system for digital governance used by governments, civil society organizations, and water and sanitation service providers in over 190 countries. The platform's free features allow users to collect data using smartphones, bring in data from Earth observations and other sources, and create effective analytics and visualizations to help prioritize interventions. mWater is designed to facilitate collaboration and longitudinal monitoring of individual pieces of infrastructure as well as entire water systems.

Space-based Solution

Addressed challenge(s)

Disappearing wetlands in North Central Nigeria

Collaborating actors (stakeholders, professionals, young professionals or Indigenous voices)
Suggested solution

Introduction

Wetlands are some of the most important habitats in the ecosystem, with the most diverse group of organisms. Wetlands are transition points between land and water. Due to pollution and climate change, our wetlands are diminishing at a geometric rate. There is an urgent need for restoration of these wetlands to encourage plant and animal diversity and ultimately ensure sustainability. Its noticed that most of the swampy lands (wetlands) in the eastern part of Kogi state of Nigeria  are diminishing very quickly. Wetlands are important to the environment because they help keep nature balanced and clean. Furthermore, they serve as a buffer zone for flood hazards in a catchment. The wetlands in the eastern part of Kogi state are mostly used for agriculture, as some crops are well suited to that type of water-logged soil. Recently (In the last 20 years, the wetlands in the region have started to disappear at a geometric rate. This disappearance of wetlands is probably caused mainly by climate change or pollution and  will prevent the attainment of SDGs 1,2,6,11,12,13,14,15.

Problem Statement

Among the most productive ecosystems in the world, wetlands offer vital functions such as flood control, carbon sequestration, water filtering, and a biodiverse habitat. Wetlands in states like Kogi, Benue, Plateau, and Niger in North Central Nigeria are essential to local livelihoods, agriculture, and fisheries. However, a combination of increasing environmental degradation, the effects of climate change, and human activities like inadequate water resource management and agricultural development is causing these habitats to disappear quickly. The degradation of wetlands in this region is driven by several interconnected factors. Wetland regions are disappearing as a result of rising pollution, deforestation, and land conversion for industrial and urban purposes. Wetland hydrology is changing due to rising temperatures, unpredictable rainfall patterns, and protracted droughts, which reduces the capacity of these ecosystems to support biodiversity and offer ecosystem services. Wetland degradation and loss have been exacerbated by the drainage and conversion of wetlands for agricultural purposes, driven by the growing demand  for arable land. The natural flow of water into wetlands has been disturbed by poor water resource management, including the construction of dams and extraction of large amounts of water. The result of the shrinking of wetlands, which are home to rare plants and animals, is the loss of biodiversity. Insufficient comprehension of the intricate connections between human endeavors and wetland ecosystems has led to unsustainable behaviors that cause harm. Despite their ecological and socio-economic importance, there is limited research on the extent, drivers, and impacts of wetland loss in North Central Nigeria. Existing studies have largely focused on other regions, such as the Niger Delta, leaving a significant gap in understanding the dynamics of wetland degradation in this area. The lack of detailed geospatial data and comprehensive analysis hinders the development of effective conservation strategies and policy interventions. The disappearance of wetlands in North Central Nigeria has far-reaching consequences, including reduced water quality, loss of biodiversity, increased vulnerability to flooding, and diminished livelihoods for local communities. Without urgent action, the continued degradation of these ecosystems will exacerbate environmental and socio-economic challenges, particularly in the face of climate change. 

Research Objectives

This research seeks to address this gap by achieving the following main objectives. By achieving these objectives, this research will contribute to a deeper understanding of wetland dynamics in North Central Nigeria and provide actionable recommendations for sustainable management and conservation.

1. Map the spatial extent of wetlands and document wetland transformation. 

  • Apply supervised classification using algorithms like Random Forest (RF) in Google Earth Engine 
  • Use NDWI, MNDWI, and SMI spectral indices to help identify water and moist soil features.
  • Perform accuracy assessment with confusion matrices and field-collected points

2. Analyze temporal changes in wetland areas: Assess how wetland areas have changed over time, using historical and current data.  Identify and record the drivers and patterns of wetland loss and degradation in the region.

  •  Perform post-classification comparison of the classified maps for each time period.
  • Generate change maps to show wetland loss, gain, or transformation (e.g., to farmland, built-up, etc.).
  • Calculate area statistics for each class and change category using GEE.

3. Provide Scientific Evidence for Conservation Efforts: Generate data-driven insights to support the development and implementation of effective wetland conservation strategies.

Expected outcomes of the space-based solution developed in the context of Space4Water

  • Quantify wetland loss over time since 1995
  • Determine trends in wetland change
  • Create comprehensive geospatial documentation
  • Assist with conservation and environmental policy  which will establish baseline information for ecological restoration

Literature Review

Ogunlade (2024) conducted a geospatial analysis of wetland distribution in Ilaje Local Government Area, Ondo State, Nigeria, using remote sensing and geospatial techniques such as NDVI, NDWI, NDMI, and NDBI. Although the study focused on southern Nigeria, its methodology and findings are relevant to understanding wetland dynamics in North Central Nigeria. The study revealed significant transformations in wetland areas, with an increase from 253.1 km² in 1986 to 354.8 km² in 2015, followed by a decline to 318.14 km² by 2019. The study projected ongoing changes by 2030, emphasizing the need to control urban encroachment to mitigate environmental hazards like flooding and soil erosion. Tobore et al. (2021) assessed the suitability of wetland soils for rice production in Ajibode, Nigeria, using GIS and remote sensing. The study analyzed Landsat 7 and 8 imagery from 2000 and 2016, alongside soil sampling, to evaluate land use changes and soil properties. Findings indicated that 75% of the soils were marginally suitable for rice production, while 20% were unsuitable. The study highlighted the importance of geospatial techniques in guiding land use decisions to sustain agricultural productivity (Tobore et al., 2021). This study is particularly relevant to North Central Nigeria, where agriculture is a major driver of wetland loss. Abubakar and Abdussalam (2024) analyzed land use changes and wetland dynamics in Kaduna Metropolis using Landsat TM/OLI imagery and SRTM DEM data. The study found a significant increase in built-up areas (194.9 km²) and a corresponding decline in wetlands, with marshlands losing 15 km² and riparian vegetation declining by 28.6 km². Urban expansion and agricultural activities were identified as primary drivers of wetland loss, underscoring the need for sustainable land use planning (Abubakar & Abdussalam, 2024). While Kaduna is in the Northwest, the findings are applicable to North Central Nigeria, where similar trends are observed. Lin and Yu (2018) investigated the loss of natural coastal wetlands in three Chinese coastal city clusters (Bohai Rim, Yangtze River Delta, and Pearl River Delta) from 1990 to 2015. The study attributed wetland loss to land conversion for agriculture and urban development, as well as ecological degradation from water pollution. The Bohai Rim experienced the highest land conversion loss, while the Yangtze River Delta faced severe ecological degradation due to pollution from inland rivers. The study emphasized the role of regional economic development in driving wetland loss and called for integrated conservation strategies (Lin & Yu, 2018). Although focused on China, the study's findings on the drivers of wetland loss are relevant to North Central Nigeria, where similar factors are at play. Akei and Babila (2022) examined wetland dynamics in Bamenda II and III Municipalities, Cameroon, using satellite imagery and field surveys. Wetlands in Bamenda II decreased from 33.91 km² in 1980 to 28.58 km² in 2020, while Bamenda III experienced a more severe decline from 13.58 km² to 9.09 km². Rapid urbanization, pollution, and biodiversity loss were identified as key drivers. The study highlighted the environmental consequences, including habitat loss and increased flooding, and advocated for both engineering and non-engineering adaptation strategies (Akei & Babila, 2022). These findings are relevant to North Central Nigeria, where urbanization and pollution are significant threats to wetlands. Several studies have demonstrated the effectiveness of using Landsat imagery combined with machine learning techniques for wetland mapping and monitoring. Xie et al. (2019) utilized Landsat-8 data with classifiers such as Random Forest and Support Vector Machines to classify wetlands in the Canadian Prairie Pothole Region, achieving high accuracy despite the complexity of wetland spectral signatures. Similarly, Wang et al. (2018) applied Random Forest to Landsat time-series data to monitor wetland changes in China’s Sanjiang Plain, achieving classification accuracy above 85%. These studies underscore the potential of Landsat-based machine learning approaches for accurate, scalable, and cost-effective wetland monitoring and conservation planning.  These technologies could be applied in North Central Nigeria to improve wetland monitoring and management.

Research Methodology

Study Area

Kogi State lies between latitudes 6°30′N and 8°40′N and longitudes 5°10′E and 8°10′E, The ground elevations range between 140 and 300 m above sea level (Ifediegwu et al., 2019). The climate of the study area is designated as Sub-Humid (AW by Koppen classification). Kogi state, is found in the Guinea savannah region with the presence of gallery forest along water courses (riparian vegetation). Time period to be studied is 30years (1995 - 2025)


ibaji Area,kogi State


Suggested solution

This ongoing project uses a space-based solution to monitor and analyze the disappearing wetlands in North Central Nigeria, particularly in Ibaji, Kogi State. collaborators have extended the methodology by incorporating wet season composites (e.g., WaterMasks_1995_2024_Fixed_Threshold_v2) to differentiate between temporary and permanent water bodies. Due to limited access to high-resolution training and validation data and time constraints, the team is currently adopting a thresholding approach to identify annual water extent patterns.

The analysis leverages Google Earth Engine and Landsat archives, focusing on changes in surface water extent over a 30-year period. The ultimate goal is to generate consistent, interpretable insights into wetland dynamics—providing a foundation for long-term conservation strategies, policy action, and ecological restoration .


Requirements

Data: 

Software:

  • Google Earth Engine: For data processing, analysis, and visualization
  • ArcGIS/QGIS: For offline mapping and advanced spatial analysis. 
  • Script used as a basis for the relative soil moisture script (Ahrari, n.a.) 
  • Script used as a basis for the Landsat Wetlands 

Code Repository

Google Earth Engine repository

Outline steps for a solution

Step-by-Step development of the solution to document wetland transformation

Description of all the steps to get to a solution

  1. Study area definition (completed)
  2. Data  Acquisition (completed)
  3. Preprocessing (in progress)
  4. Feature extraction (in progress)
  5. Classification of land cover mapping (in progress)
  6. Accuracy Assessment (in progress)
  7. Map Generation and Export (in progress)
  8. Temporal and spatial analysis (in progress)
  9. Reporting and interpretation (in progress)

1. Study area definition

  •  Identify and define the geographic boundary of the wetland area using shapefiles or administrative boundary data.
  • For this project, the focus area is Ibaji in Kogi State, North Central Nigeria which can be loaded from the "FAO/GAUL/year/level2" data
Figure 1: study area map


2. Data Acquisition

  • Access satellite imagery through Google Earth Engine (GEE) for the years 1995, 2005, 2015, 2025
  • Use Landsat 5, 7, 8, or 9 imagery for historical and current data 
  • Select images for both wet and dry seasons to capture seasonal variations. (If necessary, otherwise use the date for the beginning of the dry season.). In our study area, the wet season is April-October and the dry season is November-March. 
  • Apply filters for cloud cover (e.g., <10%) to ensure image clarity.
  • Collect in situ data for validation to identify features: wetland, farmlands, urban, tree, water body, grassland.


High-confidence interpreted data from high-resolution photography or ground-truth information gathered straight from the field are referred to as "in situ data." Every point or polygon has the appropriate land cover class (such as "wetland, water, urban, etc.") labeled on it. In situ data can be loaded as an asset, shapefile, or fusion table. When training a supervised classification algorithm such as Random Forest or SVM in GEE, you use in situ data as labeled samples (features with geometry + land cover class). Following classification, the model's accuracy in recognizing each class—for example, wetlands vs. farmlands—is evaluated using a different subset of the in situ data, known as the test set.

3. Prepossessing

  • Cloud Masking: Use built-in cloud masking functions (e.g., QA_PIXEL) to remove clouds.

The built-in cloud masking functions like QA_PIXEL are part of satellite image datasets in Google Earth Engine (GEE). Example: Cloud mask band: QA_PIXEL Collection: 'LANDSAT/LC08/C02/T1_L2'

  • Composite Creation: Generate median composites for each year or season to reduce noise.
  • Image Clipping: Clip all images to the defined study area for consistency.
  • Preprocessing of in situ data (if they lie outside of the area of interest)? 
    • To compensate for the not enough in-situ validation points within the Area of interest (AOI), we adopted a spectral similarity analysis approach. This involved extracting the multiband spectral signatures (e.g., from Landsat imagery) of known land cover types from reference points situated around and within the AOI. These signatures will then search for spectrally similar pixels within the AOI
    • By computing spectral distances (e.g., Euclidean distance) between each AOI pixel and the reference signatures, we identified and mapped areas with high spectral similarity. These areas are considered likely to represent the same land cover types as the reference points and serve as proxy validation regions for assessing the classification output. 

4. Feature Extraction

  • Compute relevant spectral indices to enhance wetland detection:
    • NDWI (Normalized Difference Water Index)—highlights surface water.
    • MNDWI (Modified NDWI) – better distinguishes water in urban/vegetated areas.
    • NDVI (Normalized Difference Vegetation Index)—helps identify vegetated wetlands.
    • Soil moisture index

In Google Earth Engine (GEE), supervised classification combined with spectral indices is an effective approach for wetland mapping. These indices help differentiate wetlands from other land cover types based on water contentvegetation, and soil moisture First, Landsat imagery is used to compute key indices such as NDWI (to highlight open water), MNDWI (to separate water from urban/vegetated areas), NDVI (to capture vegetation density), and SMI (to estimate soil moisture). These indices are added as input features. then labeled in situ data representing various land cover types (including wetlands) is used to train a classifier such as Random Forest. The trained model then classifies the image based on the spectral patterns of the indices, allowing for accurate identification and mapping of wetland areas across the landscape.

In summary

·        NDWI and MNDWI separate water from land.

·        NDVI identifies vegetated wetlands.

·        SMI enhances soil water content, especially useful in seasonal wetlands

5. Classification for land-cover mapping 

Land cover classification using satellite imagery involves identifying different surface types such as water, wetlands, vegetation, urban areas, and farmlands. In this analysis, the Random Forest algorithm is used because it handles large datasets, performs well with minimal tuning, and is robust to noise and unbalanced class sizes. Training samples are collected for each land cover type using visual interpretation of imagery. The classifier is trained using spectral bands like B3, B4, B5, and B6 (Green, Red, NIR, SWIR) , along with indices such as NDVI and NDWI. Once trained, the model is applied to classify the entire image into the defined land cover classes.

Land cover classification plays a crucial role in wetland mapping because it helps distinguish wetlands from other land cover types such as open water, vegetation, farmlands, and urban areas. Wetlands often share similar spectral characteristics with nearby features, so using classification allows for more accurate identification and delineation.

6. Accuracy Assessment

  • Collect validation samples or use known land cover points.
  • Use a confusion matrix to calculate accuracy metrics (e.g., overall accuracy, kappa coefficient).
  • Adjust classification parameters if accuracy is unsatisfactory.

7. Map Generation and Export

  • Generate classified wetland maps for each target year (1995, 2005, 2015, 2025)  or desired epoch 
  • Use GEE’s Export.image.to Drive to save maps as GeoTIFFs or other formats.
  • Optionally, create map visualizations with legends and coordinates for reporting.


Analyze Temporal Changes in Wetland Areas

8. Temporal and Spatial Analysis

  • Conduct change detection to observe wetland expansion or loss over time.
  • Use zonal statistics or pixel-based comparisons to quantify changes.
  • Compare seasonal images to distinguish between permanent and seasonal wetlands.

9. Reporting and Interpretation

  • Visualize results through maps, graphs, and time-series charts.
  • Integrate findings with contextual layers (e.g., soil, elevation) for deeper insights.
  • Prepare outputs suitable for scientific publication, policy briefs, or community engagement.


Results

Preliminary results

A first attempt to map wetland time series was performed by identifying surfacing water from the Landsat archive. The implemented method was a simple thresholding based on MNDWI. In the first round, a fixed threshold was used (0), and then dynamic thresholding was used.

One limitation is the low availability of Landsat scenes: the first images available are from 1999. The time series was thinner at the beginning (less than 10 scenes for the season, until 2003) and became thicker to the last years (more than 30 scenes, up to 60 in 2023).

Another challenge is the broader definition of wetlands, which goes beyond surfacing water bodies and includes specific vegetation   adapted to live in saturated soil conditions, so the current method addresses only partially the wetland characterization. 

To overcome the first limitation, we have no possibility from space  because Landsat is the longest space mission available. For the second, we will explore the most suitable features to characterize these complex environments, such as phenological features from optical data and soil moisture from SAR data.

Impact of the solution

Accurate Monitoring of Wetlands

The space-based system will give accurate and up-to-date information on the location and extent of wetlands in North Central Nigeria. Satellite images and GIS tools make it easier to track changes in wetland areas over time. This is especially significant in recognizing regions where wetlands are diminishing or disappearing as a result of climate change or human activities.

Informed Decision-Making

By analyzing the patterns and causes of wetland loss, the solution will assist policymakers and environmental managers in making educated decisions. It will help to design focused conservation policies, such as safeguarding vulnerable areas, regulating land use, and directing ecological restoration activities. The data collected will be used as scientific proof for environmental planning and sustainable development.

Community Awareness and Engagement

In addition, the solution will assist in raising awareness among communities and stakeholders by offering visual maps and simple insights. These tools can help the public understand the importance of wetlands and inspire community involvement in their protection.

Support for Biodiversity and Climate Resilience

Over time, this method will help to conserve biodiversity, minimize flood risk, and improve the region's ability to adapt to climate change. Wetlands serve an important role in preserving ecological balance, and protecting them helps to ensure long-term environmental and socioeconomic stability.

Relevant publications

Abubakar, Muhammad Lawal, and Auwal Farouk Abdussalam. "Geospatial analysis of land use changes and wetland dynamics in Kaduna Metropolis, Kaduna, Nigeria." Science World Journal 19, no. 3 (2024): 687-696.

Lin, Qiaoying, and Shen Yu. "Losses of natural coastal wetlands by land conversion and ecological degradation in the urbanizing Chinese coast." Scientific reports 8, no. 1 (2018): 15046.

Leemhuis, Constanze, Frank Thonfeld, Kristian Näschen, Stefanie Steinbach, Javier Muro, Adrian Strauch, Ander López, Giuseppe Daconto, Ian Games, and Bernd Diekkrüger. 2017. "Sustainability in the Food-Water-Ecosystem Nexus: The Role of Land Use and Land Cover Change for Water Resources and Ecosystems in the Kilombero Wetland, Tanzania" Sustainability 9, no. 9: 1513. https://doi.org/10.3390/su9091513

Meusburger, Katrin. "Mapping spatio-temporal dynamics of the cover and management factor (C-factor) for grasslands in Switzerland." (2018).


Related space-based solutions
Keywords (for the solution)
Climate Zone (addressed by the solution)
Habitat (addressed by the solution)
Region/Country (the solution was designed for, if any)
Relevant SDGs