

At sunrise in Bundelkhand, Northern India, farmer Ramesh Patel walks across a cracked wheat field, where the delayed and weak monsoon has left his crops wilting and wells running dry. Over the past five years, wells have sunk several meters, and groundwater levels in the region have fallen steadily for more than two decades (CGWB 2021; Niranjannaik et al. 2022). He is not alone: farmers, water managers, industries, and hydropower operators around the world face the same urgent question—how much water do we really have?
UNESCO estimates that 2.2 billion people currently experience water shortages, while agriculture accounts for approximately 72 percent of global freshwater withdrawals, and demand is projected to rise by 55 percent by 2050 (UNESCO 2024). As scarcity intensifies, conflicts among agricultural, urban, and industrial users are growing. International frameworks such as Sustainable Development Goal (SDG) 6 which calls for ensuring availability and sustainable management of water and sanitation for all and the Paris Agreement, which emphasizes water resilience as part of climate adaptation, both underscore the importance of evidence-based water governance (United Nations 2015; UNFCCC 2015).
This is where water accounting and auditing become essential. They help answer not only “How much water do we have?” but also “Where is it going?”, “Who uses it?”, and “Is it being used sustainably?” Advances in space-based technologies including the Gravity Recovery and Climate Experiment (GRACE), the Surface Water and Ocean Topography (SWOT) mission, and the Soil Moisture Active Passive (SMAP) satellite are revolutionizing these practices by tracking groundwater depletion, surface water levels, and soil moisture in near real time . Systems such as Open Evapotranspiration (OpenET) and the Food and Agriculture Organization’s Water Productivity through Open-access of remotely sensed derived data (WaPOR) platform are now transforming satellite data into actionable maps for irrigation planning and water productivity (NASA 2023). Together, these “eyes in the sky” provide transparent and cost-effective monitoring, even in remote or transboundary regions, enabling policymakers to design fairer water-sharing rules, guide conservation, and ensure that every drop is measured and managed wisely (UNESCO 2023). A global shift toward evidence-based water governance is now within reach and space technology lies at its core.
Water accounting and water auditing
What is water accounting and auditing?
Water challenges are intensifying due to climate variability, rapid population growth, and competing demands from agriculture, cities, energy sectors, and ecosystems. To manage water effectively and equitably, countries and river basin authorities are increasingly turning to water accounting and water auditing—two complementary tools that enhance transparency and accountability in water governance, much like financial accounting does for money.
Water accounting is the systematic process of identifying, quantifying, and reporting water flows, stocks, and uses within a defined spatial and temporal boundary (Molden 1997; FAO 2016). It answers fundamental questions on the quantity, sources and uses of this valuable resource. By providing a structured and comparable framework, water accounting enables planners to identify inefficiencies, evaluate trade-offs, and support sustainable allocation.
Water auditing, in contrast, evaluates how water is managed by assessing losses, allocation efficiency, governance performance, and compliance with established water plans or regulations (Global Water Partnership 2012; FAO 2012). It promotes transparency by ensuring that water data is reproducible, verifiable, and subject to independent review. Institutional integrity is central to this process: audits must be conducted or certified by qualified professionals to maintain credibility. For example, in the U.S. state of Georgia, the Qualified Water Loss Auditor (QWLA) certification administered by the Georgia Environmental Protection Division ensures that auditors possess the technical expertise required to validate and certify water audits accurately (Georgia EPD 2020). Addressing uncertainty is equally vital, as errors stemming from measurement inaccuracies, data handling, or human estimation can lead to misinterpretation (WRF 2016). A comprehensive water audit checklist (Figure 1) typically includes assessing system input volumes, identifying authorized consumption, and quantifying both real and apparent losses — steps that together support evidence-based water management and policy development (Water Efficiency Alliance 2021).

This schematic illustrates the standard water balance framework used to categorize system input volume into billed authorized consumption, unbilled consumption, apparent losses, and real losses. It differentiates between revenue water and non-revenue water (NRW) and is widely applied by utilities for water audit and loss control program. Source: (Alliance for Water Efficiency, n.d.).
While water accounting is about measurement, water auditing is about evaluation and accountability. Water accounting and auditing follow a structured and iterative framework that integrates technical assessments with stakeholder engagement. Figure 2 shows the overall approach to water accounting and auditing illustrating the interrelationship between water accounting, water auditing, and stakeholder engagement activities.
Together, these tools support Integrated Water Resources Management (IWRM) by improving transparency, reducing conflicts, and guiding equitable allocation.
The water budget concept
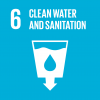
The water budget concept is central to water accounting and water auditing. This concept It helps in understanding the dynamics of water availability and usage within a system. Figure 3 illustrates the total water budget concept, showing that all major fluxes, including precipitation, streamflow, groundwater recharge, and evapotranspiration, are tracked across the land system, surface water system, and groundwater system to ensure a complete accounting of water inflows and outflows.
At the core of all water accounting systems is the water balance equation (Healy and Scanlon 2010), also known as the water budget:
where P is precipitation, ![]() is water entering the system, ET is evapotranspiration (including soil, plant, and surface water losses), ΔS is the change in storage, and
is water entering the system, ET is evapotranspiration (including soil, plant, and surface water losses), ΔS is the change in storage, and ![]() is water leaving the system. This equation embodies the principle of mass conservation, essentially stating that water entering a system must equal water leaving it plus any changes in storage.
is water leaving the system. This equation embodies the principle of mass conservation, essentially stating that water entering a system must equal water leaving it plus any changes in storage.
This equation reflects a simple truth: water in = water out ± storage change (Healy and Scanlon 2010). Whether applied to a farm, aquifer, reservoir, river basin, or nation, every water account begins with this balance.
Frameworks for water accounting
Several international frameworks formalize water accounting to support policy and planning. The System of Environmental-Economic Accounting (SEEA)-Water framework by the United Nations Statistics Division (UNSD)(Replace with official acronym) links hydrology with national economic statistics for policy reporting especially SDG 6.4 on water-use efficiency (UNSD 2012). Water Accounting Plus (WA+), led by Food and Agriculture Organization (FAO) and United Nations Educational, Scientific and Cultural Organization – Institute for Water Education (UNESCO-IHE), produces basin-level water accounts using remote sensing and GIS making it especially valuable in data-scarce regions (Karimi et al. 2013; Bastiaanssen et al. 2015). Unlike SEEA-Water, WA+ explicitly separates beneficial water consumption (e.g., crop evapotranspiration) from non-beneficial evaporation (e.g., evaporation from canals). Additionally, the concept of basin-level water audits, as advanced by the FAO, provide diagnostic assessments of water governance, resource availability and use. These audits help guide sustainable water management decisions by integrating technical, institutional and political dimensions. water governance and scarcity, helping guide sustainable water management decisions.
“Sustainability is key. Water accounting, which integrates satellite data, modelling, and ground-based measurements, can provide a better understanding of water availability, how and when to use it, and how it changes over time. Effective planning, especially for groundwater, is critical for sustainable water management.”
— Dr. Claudia Sadoff, Director General, International Water Management Institute (IWMI, 2019)
To make water accounting and auditing truly effective at scale, we now turn to the space technologies that provide the data backbone for these methods.
Space-based technologies for water accounting and auditing
Space-based technologies have transformed water accounting by providing accurate, timely data on groundwater, surface water, soil moisture, precipitation, and evapotranspiration. Table 1 provides an overview of relevant datasets. These measurements by satellites complement ground observations, and are thus enabling evidence-based water management, efficient allocation, and drought preparedness.
| Space Technology | Sensor | Agency | Measured Parameter(s) | Spatial Coverage | Typical Temporal Resolution | Primary Purpose (Hydrology) | Water-Accounting Relevance | Water-Auditing Relevance |
| GRACE | K-band microwave inter-satellite ranging (KBR) | NASA; GFZ | Gravity anomalies → terrestrial water storage (TWS) anomalies (integrated mass: groundwater, surface water, soil moisture, snow) | Global; effective spatial sensitivity ≈150–300 km (basin scale) (GRACE Tellus) | Monthly standard solutions; rapid/near-real-time products available (reduced accuracy) (GRACE Tellus) | Quantify basin-scale integrated mass changes and long-term storage trends | Basin-scale ΔTWS for budgets and long-term aquifer change detection (GRACE Tellus) | Detects basin-scale depletion and validates mass balance components when combined with auxiliary data (GRACE Tellus) |
| GRACE-FO | K-band microwave ranging (KBR) with an optional Laser Ranging Interferometer (LRI) | NASA; GFZ | Gravity anomalies → TWS anomalies; improved intersatellite ranging reduces some noise | Global; effective spatial sensitivity ≈150–300 km (GRACE-FO) | Monthly standard; rapid products available; continues GRACE time series (GRACE-FO) | Continue GRACE time series for multidecadal TWS monitoring | Continued basin-scale trend detection crucial for multidecadal accounting (GRACE-FO) | Audits long-term groundwater trends and basin mass changes; requires ancillary data for attribution (GRACE Tellus) |
| SWOT | Ka-band radar interferometer | NASA; CNES | Water surface elevation; river/lake width and area → reach-scale storage and discharge proxies | Global; ~120 km swath; resolves lakes ≳0.06–0.5 km² and rivers ≳100–200 m width depending on SNR and processing (NASA SWOT) | Nominal 21-day repeat; effective revisit can be shorter for some basins due to orbit overlap (NASA SWOT) | Map inland water surface elevation and hydraulic geometry at reach scale | Provide reach/reservoir volume and elevation changes for surface-water accounting (podaac.jpl.nasa.gov) | Detects reservoir/river level changes and supports audits of inflow/outflow and operations when combined with hydraulic models (NASA SWOT) |
| Sentinel-1 | C-band synthetic aperture radar | ESA Copernicus | SAR backscatter and coherence → inundation extent; change detection; surface wetness proxies | Global land/water; typical acquisition geometry yields nominal 6-12 day revisit depending on latitude and acquisition plan (European Space Agency) | 6-12 days nominal for constellation; acquisition frequency varies by mode and latitude (Earth Observation Portal) | Map inundation extent, flood dynamics, and surface change under all weather | High-frequency inundation extent time series for surface-water accounting at basin scale (Earthdata) | Detects unsanctioned surface water use, flood events, and reservoir/canal surface changes for auditing (Earthdata) |
| Sentinel-2 | MSI optical multispectral | ESA Copernicus | Surface reflectance → NDWI, NDVI, crop indices, surface water extent, turbidity proxies | Global land; 10–20 m bands relevant for water; combined revisit ~5 days with both satellites (cloud dependent) (Earthdata) | ~5 days combined revisit; cloud dependent (European Space Agency) | High-resolution mapping of surface water, vegetation, and crop condition | Field to basin surface extent and crop status inputs for water accounting and area allocation (Earthdata) | Validates reported irrigation areas and supports crop ET and irrigation audits subject to cloud limits |
| Landsat (OLI/TIRS) | OLI multispectral and TIRS thermal | USGS; NASA | Reflectance and thermal → NDWI, land cover, surface temperature, ET proxies | Global land; 30 m multispectral; thermal 30 m resampled; per-satellite 16-day revisit, combined satellites yield ~8-day effective revisit where both collect (USGS) | 8–16 days depending on number of operational satellites and acquisitions (Landsat Science) | Long-term surface water, thermal energy balance, land-cover and ET monitoring | Field-scale accounting, irrigation mapping, and long-term trend detection using multi-decadal archive (Landsat Science) | Historical baseline for auditing changes in irrigation, reservoir area, and land-use over decades (ScienceDirect) |
| MODIS (Terra/Aqua) | Optical and thermal multispectral sensors | NASA | Reflectance and thermal → vegetation indices, coarse water extent, ET proxies | Global; band-dependent native resolution 250–1000 m (LAADS DAAC) | Daily to 1–2 days global coverage depending on band and cloud cover (Earthdata) | Regional to global ET and vegetation monitoring and coarse surface-water mapping | Regional ET and anomaly time series for basin accounting and trend analysis (LAADS DAAC) | Daily anomaly detection and consistent long-term records support operational auditing at regional scales (MODIS) |
| GPM | DPR radar and GMI radiometer plus constellation | NASA; JAXA | Precipitation intensity and distribution (liquid and solid phases estimates) | Global; fused gridded products commonly at ~0.1° (~10 km); instantaneous swath finer (GPM Mission) | Sub-daily gridded products; operational products hourly to 3-hourly; instantaneous orbital revisits vary | Quantitative precipitation estimation for forcing hydrologic models and event analysis | Provides precipitation forcing (P) for water budgets and model inputs at basin scale (GPM Mission) | Verifies reported inflows and event-scale accounting; solid precipitation estimation requires caution (GPM Mission) |
| ICESat-2 | Photon-counting laser altimeter | NASA | Along-track surface elevation profiles → lake/reservoir stage, river cross-section heights, snow surface elevation | Global polar-centric coverage; along-track sampling rather than wall-to-wall maps; dense repeated tracks over years (ICESat-2) | Orbit subcycle sampling; irregular along-track revisit patterns useful for trend detection (ICESat-2) | Precise surface elevation for water levels, ice, and snow; calibrate other remote sensing products | High-precision stage measurements for reservoir and lake storage estimation and calibration of SWOT and models (National Snow and Ice Data Center) | Provides cm-level validation for auditing lake/reservoir height changes and validating height-derived volume (National Snow and Ice Data Center) |
| SMAP | L-band radiometer (radar failed early) | NASA | L-band brightness temperature → surface soil moisture (~top 5 cm) and freeze-thaw state | Global; nominal radiometer footprint ~36 km; downscaled products available (SMAP) | ~2–3 day revisit for radiometer retrievals (SMAP) | Surface soil moisture and landscape freeze-thaw mapping to constrain surface water and drought status | Constrains upper-soil storage and supports model assimilation to infer deeper storage changes (SMAP) | All-weather seasonal storage and drought auditing support subject to vegetation and roughness impacts (SMAP) |
With a foundation in satellite capabilities established, the next step is to explore how these datasets are transformed into actionable water accounts and audits.
Methods: From satellites to accounts
Reliable water accounting and auditing frameworks use satellite-derived datasets combined with hydrological models and field validation to create water balance assessments and water use ledgers at basin, national, or irrigation-district scales. The workflow progresses from raw space-based observations to decision-ready water accounts through a transparent sequence of steps.
Step 1: Satellite data acquisition
Earth observation missions provide continuous monitoring of key hydrological variables relevant to water accounting as shown in Table 2. For example, evapotranspiration (ET) and biomass production are retrieved from MODIS and Landsat datasets, while surface water extent is identified using Sentinel-1 SAR and Sentinel-2 optical imagery (Bastiaanssen et al. 2015). FAO’s Water Productivity through Open Access Remotely-Sensed Derived Data (WaPOR) portal delivers 10 m to 250 m resolution ET, biomass, and land use layers across Africa and the Near East, making it a practical operational data services supporting water accounting (FAO 2020). As shown in Figure 4, the WaPOR system translates remote sensing data into actionable insights for improving agricultural water efficiency.

| Hydrological Variable | Satellite Sensor / Product | Spectral Bands / Signal Type | Spatial Resolution (typical / operational) | Temporal Resolution (typical) | Analytical Method / Index |
| Actual Evapotranspiration (ET) | MODIS (Terra/Aqua, MOD16), Landsat 8/9 (OLI/TIRS), VIIRS | Optical (VIS–NIR–SWIR), Thermal IR | MODIS products: 250 m / 500 m / 1 km (MOD16A2 ET = 500 m); Landsat multispectral 30 m (thermal native 100 m, often resampled); VIIRS 375 / 750 m. (LAADS DAAC) | MOD16: 8-day (500 m composite); Landsat single sat 16-day (combined L8+L9 ~8-day); VIIRS daily (I-band 375 m). (Google for Developers) | SEBAL, METRIC, ETLook, SEBS; surface energy balance and LUE approaches. (Montana DNRC) |
| Vegetation/ Biomass | MODIS (MOD13/MOD15), Sentinel-2 MSI, Landsat | VIS–NIR (red, NIR), SWIR | MODIS VI/EVI products: 250–500 m; Sentinel-2 MSI: 10 / 20 / 60 m; Landsat: 30 m. (MODIS) | MODIS: daily → composites (8-day, 16-day) / Sentinel-2: 10→5–10 days (constellation); Landsat: 16-day (single) / ~8-day (L8+L9). (NASA Earthdata) | NDVI, EVI, LAI, LUE and process models. |
| Surface Water Extent / Inundation | Sentinel-1 SAR (C-band), Sentinel-2 MSI, Landsat OLI | Radar backscatter (VV/VH), Optical (NIR/SWIR) | Sentinel-1: ~10 m sampling (products vary); Sentinel-2: 10–60 m; Landsat: 30 m. | Sentinel-1: single sat ~12 days, dual sat ~6 days; Sentinel-2: 10 d per sat / ~5 d constellation; Landsat: 16 d (single) / ~8 d (L8+L9). | NDWI/MNDWI thresholding, SAR change detection, ML classifiers (pixel/obj). |
| Precipitation | TRMM 3B42 (archived), GPM IMERG, CHIRPS | Passive microwave; IR brightness and merged algorithms; gauge-adjusted blended products | TRMM 3B42: 0.25° (~25 km); GPM IMERG: 0.1° (~10 km); CHIRPS: 0.05° (~5 km). (Google for Developers) | TRMM 3-hour; GPM IMERG ~30 min (HHR) and 3-hr/1-day aggregates; CHIRPS daily (also monthly). (GPM Mission) | Multi-satellite retrieval algorithms; gauge bias correction. |
| Soil Moisture | SMAP (L-band radiometer), Sentinel-1 SAR (C-band) and blended products | Microwave radiometer/radar; SAR backscatter | SMAP radiometer: standard grid 36 km (L3); enhanced/combined products at 9 km / 3 km; research downscales to 1 km. Sentinel-1: ~10 m SAR pixels but SM retrievals are generally produced at coarser (100 m–1 km) grids operationally. (National Snow and Ice Data Center) | SMAP: ~2–3 day revisit (global); SMAP L3: daily composites; Sentinel-1: revisit depends on orbit/constellation (single 12 d / dual ~6 d). (National Snow and Ice Data Center) | Radiometer brightness-temp inversion, backscatter inversion, data fusion (SMAP+S1), ML downscaling. |
| Land Use / Land Cover | Landsat, Sentinel-2, MODIS, commercial data | Optical (VIS–NIR–SWIR) | Sentinel-2: 10–60 m; Landsat: 30 m (MS); MODIS: 250–1,000 m — choose resolution by sensor used. (NASA Earthdata) | MODIS: daily composites; Sentinel-2: 5–10 days constellation; Landsat: 16 d (single) / ~8 d (L8+L9). (NASA Earthdata) | Supervised/unsupervised classification (RF/SVM/NN), change detection. |
| Water Storage / Groundwater | GRACE & GRACE-FO (mascon / spherical harmonic products) | Time-variable gravity / mass anomaly | Effective spatial resolution ≳ ~300 km (mascon/spherical harmonic monthly solutions). (GRACE Tellus) | Monthly (typical public products). | Mascon inversion; spherical harmonic processing; filtering. |
Step 2: Pre-processing and data harmonization
During the pre-processing, raw satellite data are corrected for atmospheric effects, resampled to common spatial grids, and temporally aligned using compositing methods such as maximum value composite (MVC) or median compositing, which merge multiple observations from a given period to reduce noise and data gaps caused by clouds and sensor errors. Cloud masking and noise reduction are applied to remove contamination from clouds, haze, shadows, and sensor noise, ensuring that only reliable surface reflectance data are used for further analysis (Senay et al. 2016).
Input datasets are harmonized before hydrological balance calculations to ensure consistency between precipitation (P), evapotranspiration (ET), runoff (Q), and storage change (ΔS) components.
Step 3: Model fusion and partitioning (WA+ workflow)
After satellite data are acquired and pre-processed, water accounting frameworks typically combine multiple datasets with hydrological models to partition water flows and quantify their use by sector, ecosystem, or service type. This process, often referred to as model fusion and partitioning, integrates information on precipitation, evapotranspiration, runoff, and storage change from remote sensing with field-based or modeled hydrology to produce consistent, spatially explicit water accounts. Numerous modeling frameworks exist to perform this integration, including custom basin-scale models, regionally adapted hydrological simulators, and operational water accounting systems.
For demonstration purposes, we focus on the Water Accounting Plus (WA+) framework (Karimi et al., 2013). WA+ is widely used in conjunction with FAO’s WaPOR dataset because it provides a transparent, operational workflow that distinguishes between beneficial and non-beneficial water uses, partitions flows by land-use type, and supports decision-making at both, basin and managed-unit scales. While other frameworks could be applied, WA+ was chosen here due to its clear methodology, public accessibility, and strong precedent in water accounting literature, making it an ideal example for illustrating the transition from satellite observations to actionable water accounts.
The Water Accounting Plus (WA+) framework integrates remote sensing products with hydrological modelling to partition water flows by land use and service type (Karimi et al., 2013). Using WaPOR-derived ET and biomass data, WA+ distinguishes beneficial uses (crop production, ecosystem services) from non-beneficial ones (evaporation from bare soil or water surfaces).
At the basin scale, the total water balance is expressed as:
where: ![]() = precipitation,
= precipitation, ![]() and
and ![]() = surface + groundwater inflows and outflows,
= surface + groundwater inflows and outflows,
ET= actual evapotranspiration (depletion), and ![]() = change in storage (surface, groundwater, snow, and soil moisture).
= change in storage (surface, groundwater, snow, and soil moisture).
For managed water-use units (e.g., irrigation districts) where withdrawals and returns are explicit, the equation becomes:
where W= withdrawals, R= return flow, ![]() = ET from precipitation, and
= ET from precipitation, and ![]() = incremental ET attributable to withdrawals (Karimi & Bastiaanssen, 2015).
= incremental ET attributable to withdrawals (Karimi & Bastiaanssen, 2015).
Step 4: Creating water ledgers and accounts
Outputs from the model fusion stage (Step 3) are structured into the standardized Water Accounting Plus (WA+) Sheets, which together contain the Water Ledger. This is the final stage of information synthesis, resulting in transparent, quantitative reports on water resources.
Outputs are structured into standardized water accounts, including:
- Surface and groundwater balances (Resource Base Sheet- Assests & liabilities)
- Consumptive use by sector (Evapotranspiration Sheet- Profit & loss/expenditure sheet)
- Water productivity (kg/m³) (Productivity Sheet- Profit)
- Renewable supply and environmental flows (Withdrawal sheets – Cashbook)
This is visualised in Figure 5 by the Sheets (which contain the Water Ledger) and the resulting graphs and maps (which are the annual and spatial accounts), shown at the bottom and right.

Step 5: Handling uncertainty and validation
Due to sensor limitations and atmospheric interference, uncertainty corrections are required for satellite retrievals; validation targets the satellite-derived retrievals and the hydrological/data-assimilation models that generate WA+ components (e.g., ET, precipitation, surface extent/height, and TWS), using observations from river gauges, weather stations, soil-moisture probes, lysimeter and eddy-covariance ET measurements, groundwater wells, and lake/reservoir gauges (McCabe et al., 2017). The Remote Sensing Correction for Groundwater (RECOG) method further improves WA+ outputs by adjusting satellite water balance estimates using GRACE-based storage anomalies (van Dijk et al., 2018; Deggim et al., 2021). This step ensures robust and transparent water accounts that are aligned with observed hydrology.
To see these methods in action, we will now examine a few real-world applications where space-based water accounting has improved decision-making across diverse regions.
Global applications of satellite-based water accounting and auditing
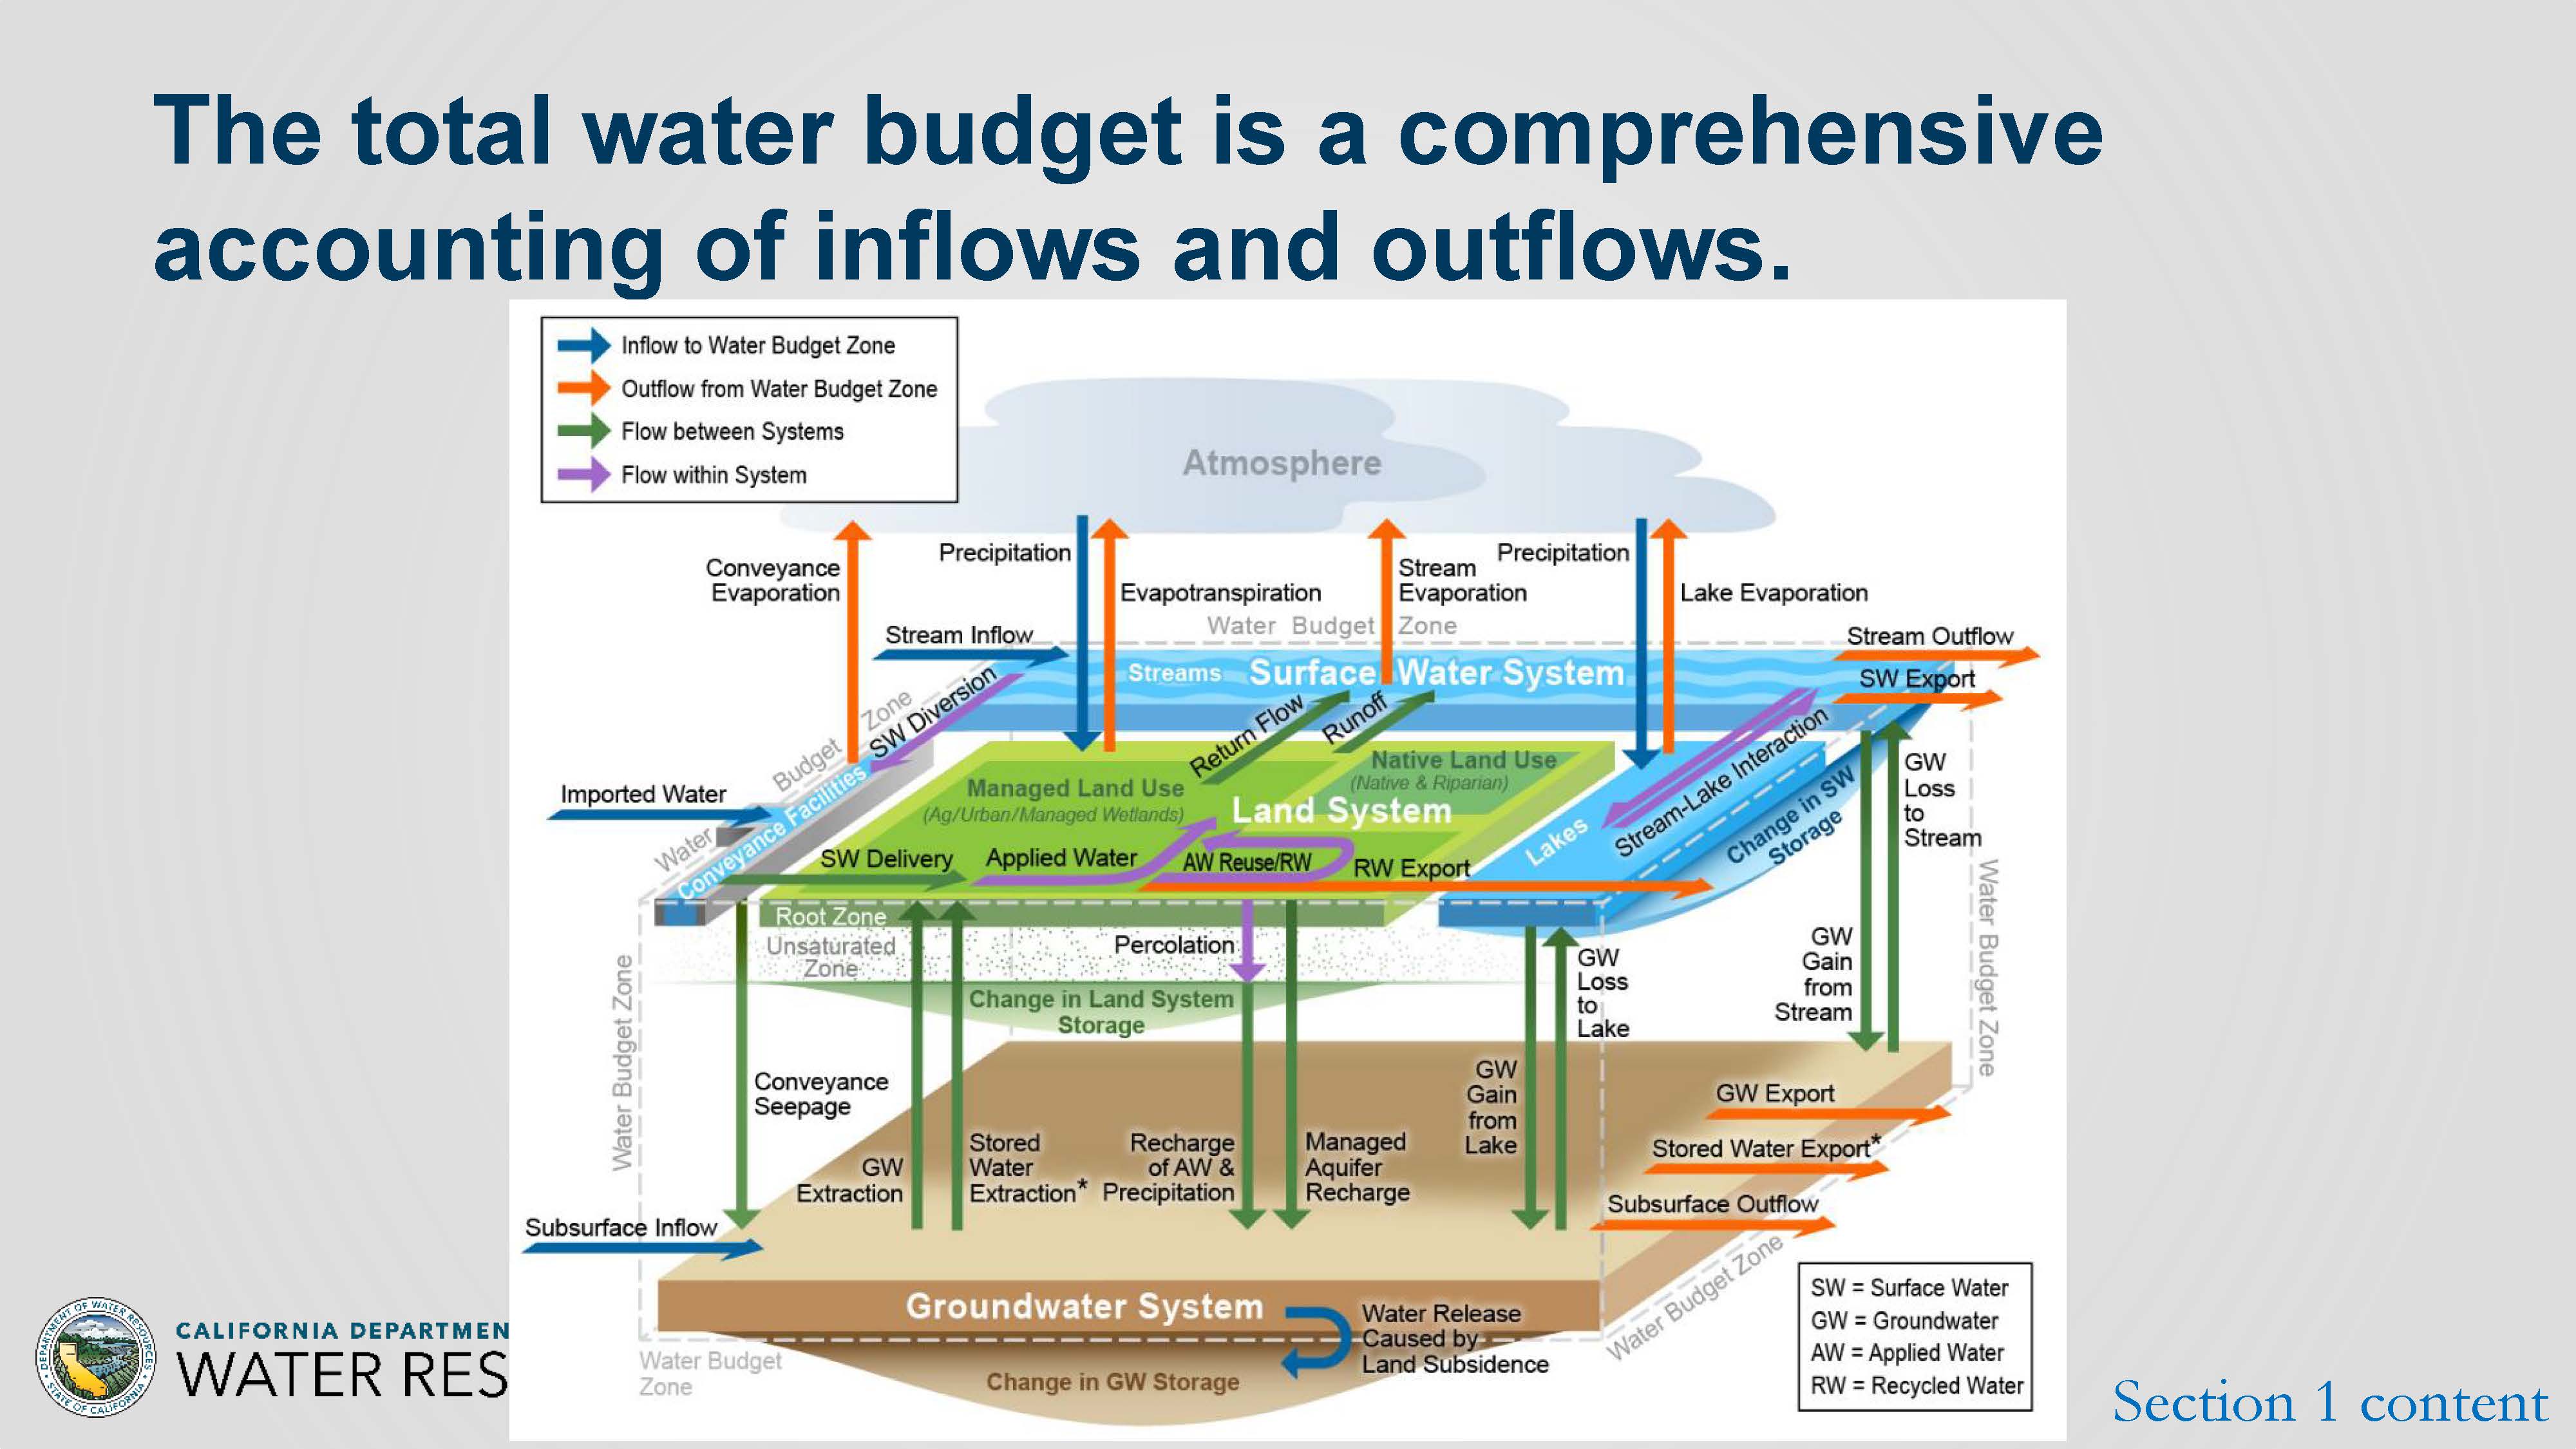
Satellite technology is transforming global water management by revealing hidden patterns in water use and scarcity. In California’s Central Valley, the GRACE satellite exposed critical groundwater depletion averaging 2.41 km³ per year during 2003-2021; and peaking at 8.58 km³ per year during the 2019–2021 megadrought. This important observation lead to new groundwater regulations under the Sustainable Groundwater Management Act (SGMA) (Liu et al., 2022). As shown in Figure 6, the GRACE mission also revealed significant groundwater changes across the U.S. Water Accounting Plus (WA+) has been used in major basins like the Indus and Vietnam’s Ca River to quantify water flows and consumption using remote sensing, improving irrigation planning and national water policy decisions (Karimi, Bastiaanssen, and Fenn 2013; Bastiaanssen, Ha, and Fenn 2015). The Surface Water and Ocean Topography (SWOT) mission greatly enhances monitoring of lakes and reservoirs across diverse settings, from large inland systems like the Great Lakes and African rift lakes to cascade and run-of-river reservoirs in the Mekong and Amazon basins by providing high-resolution, spatially continuous maps of water levels and extents that reveal seasonal and event-scale dynamics previously undetectable from single-track altimeters (Biancamaria, Lettenmaier, & Pavelsky, 2016). Complementing this, GRACE and GRACE-FO capture basin-scale terrestrial water-storage variations critical for managing ecosystems and supporting river-dependent communities where groundwater–surface water exchanges and floodplain storage sustain livelihoods and navigation. Illustrative examples include floodplain populations and ports along the Amazon mainstem (e.g., Manaus, Iquitos, Belém), where millions of people rely on floodplain fisheries, agriculture, and navigation (Renó, Novo, & Escada, 2016); communities shaped by the Mekong flood pulse, where seasonal inundation supports fisheries and paddy agriculture essential to over 60 million people (Tran et al., 2024); and riparian settlements across the Ganges basin, where more than 500 million people depend on river water for food production and livelihoods (Singh et al., 2016).
Building on these successes, the next section outlines how countries and water managers can begin implementing space-enabled water accounting systems.
Implementing space-enabled water accounting
Implementing space-enabled water accounting involves translating satellite observations into actionable water management information through a structured, phased approach. This roadmap addresses both, technical and institutional challenges, ensuring scalable, transparent, and sustainable water governance (FAO, 2016; Bastiaanssen et al., 2015; Sheffield et al., 2018; UNESCO, 2021).
By following a stepwise framework, water managers can gradually integrate satellite-based monitoring into planning and decision-making, build local capacity, ensure independent verification, and ultimately scale water accounts from local to regional or national levels. The phased approach is summarized in Table 3.
Step 1: Pilot Testing
Pilot testing focuses on selecting small, representative basins to implement the WA+ workflow. Using satellites such as GRACE/GRACE-FO for groundwater, SWOT for surface water, and Sentinel series for evapotranspiration and soil moisture, pilot tests provide initial insights into water stocks, flows, and deficits (Bastiaanssen et al., 2015). This low-risk stage validates data integration and workflow functionality, though limited spatial resolution and initial investment costs may restrict capturing full variability.
Step 2: Open Data Adoption
Open data adoption promotes the use of publicly available satellite datasets, open-source processing tools, and transparent workflows (FAO, 2016). Platforms such as FAO WA+, NASA Earthdata, ESA Copernicus, MODIS, and Landsat enable reproducible and cost-effective water accounts. Open adoption facilitates inter-agency collaboration and scalability, although data gaps, cloud cover, and the need for local calibration remain challenges.
Step 3: Capacity Building
Capacity building ensures that water managers, policymakers, and stakeholders gain the knowledge and skills to use water accounting outputs effectively (UNESCO, 2021). Workshops, online courses, and research collaborations strengthen local technical expertise, enhance decision-making, and foster ownership of water management processes. Sustaining training programs and mitigating staff turnover are key challenges in this step.
Step 4: Operationalisation
Operationalisation integrates water accounts into routine water planning and management. By combining WA+ modeling with satellite and in-situ measurements, managers can monitor water stocks, flows, and withdrawals in near real-time (Sheffield et al., 2018). This step enables evidence-based planning, proactive drought management, and optimized water allocation, though coordination across agencies and resistance to change may hinder implementation.
Step 5: Independent Audits
Independent audits introduce verification and quality control mechanisms to ensure accuracy and credibility. Methods include RECOG corrections for GRACE and combined satellite-field validation (FAO, 2016). Independent audits enhance transparency, build stakeholder trust, and validate sustainable water use, although political sensitivity, funding constraints, and limited data access can pose challenges.
Step 6: Scale-Up
The scale-up phase expands water accounting from pilot basins to regional or national scales, integrating all previously used satellites and the WA+ framework. Comprehensive water accounts support integrated water resource management and SDG 6.4.2 reporting (Bastiaanssen et al., 2015). Scaling requires harmonizing methods, increasing computational capacity, and managing large datasets across multiple basins.
Step 7: Continuous Improvement
Continuous improvement involves updating methodologies, integrating next-generation satellites (SWOT, NISAR), and applying improved retrievals for evapotranspiration and groundwater (Sheffield et al., 2018; UNESCO, 2021). This adaptive approach reduces uncertainty, improves resilience to climate variability, and ensures that water governance remains future proof. Maintaining technical expertise and securing sustained funding are critical challenges for this phase.
| Step | Objective | Actions / Approach | Relevant Space Technology | Expected Outcomes | Key Benefits | Implementation Challenges |
| 1 | Pilot Testing | Select small, representative basins to implement WA+ workflow | GRACE/GRACE-FO (groundwater), SWOT (surface water), Sentinel series (ET & soil moisture) | Baseline water stocks, flows, and deficits identified | Low-risk testing; validation of workflow and data integration | Limited spatial resolution; initial investment; pilot may not capture full variability |
| 2 | Open Data Adoption | Use publicly available satellite data, open-source processing tools, and open workflows | FAO WA+, NASA Earthdata, ESA Copernicus, MODIS, Landsat | Cost-effective, transparent, reproducible water accounts | Enables collaboration across agencies; scalable | Data gaps, cloud cover, need for local calibration |
| 3 | Capacity Building | Train water managers, policymakers, and stakeholders | Workshops, online courses, research collaborations | Improved technical capacity and informed decision-making | Local ownership of water accounting; better operational decisions | Sustained training needed; staff turnover may reduce knowledge retention |
| 4 | Operationalisation | Integrate water accounts into regular planning and management processes | WA+ modelling, satellite + in-situ integration | Routine monitoring of water stocks, flows, and use | Evidence-based planning; proactive drought and allocation management | Coordination across agencies; resistance to change |
| 5 | Independent Audits | Establish independent verification and quality control mechanisms | RECOG corrections for GRACE, satellite + field validation | Validation of water use efficiency and sustainability | Transparency and credibility in decision-making | Political sensitivity; funding limitations; restricted data access |
| 6 | Scale-Up | Expand from pilot basins to regional/national scale | All above satellites, WA+ framework | Comprehensive water accounts covering multiple basins | Supports integrated water resource management; SDG 6.4.2 reporting | Increased computational and data management needs; regional harmonization |
| 7 | Continuous Improvement | Update methods and incorporate new satellites and models | Next-gen missions: SWOT, NISAR, improved ET/groundwater retrievals | Reduced uncertainty; adaptive management | Future-proof water governance; resilient to climate variability | Sustaining funding, technical expertise, and adaptation to new technologies |
As we conclude, we reflect on what space-enabled water accounting means for the future of water governance and for people like Ramesh who depend on it.
Conclusion
Satellite technologies are fundamentally transforming water accounting and auditing by providing high-resolution, near-real-time monitoring of hydrologic variables across multiple spatial and temporal scales. These capabilities allow for more accurate assessment of water storage, surface and groundwater fluxes, and human withdrawals, reducing uncertainties that traditionally hindered water management. The continuity of long-term missions such as GRACE-FO and SWOT ensures consistent and reliable datasets, which are critical for tracking trends, detecting anomalies, and evaluating the impacts of climate variability and human interventions. Furthermore, advancements in sensor technology, data assimilation, and integration with ground-based observations enhance both the precision and comprehensiveness of water information. By enabling transparent and reproducible analyses, satellite-based monitoring strengthens governance frameworks and supports evidence-based policy decisions.
For communities like Ramesh Patel’s in Bundelkhand, these innovations mean that water scarcity can be monitored more reliably, informing better management of groundwater, surface water, and irrigation resources. By combining space-based observations with local knowledge and independent audits, water managers can make evidence-based decisions that ensure sustainable and equitable water access for farmers, cities, and ecosystems alike.

Alliance for Water Efficiency. n.d. “Water Audit.” Accessed October 30, 2025. https://allianceforwaterefficiency.org/resource/water-audit .
Bastiaanssen, W. G. M., H. Ha, and T. Fenn. 2015. Water Accounting Plus (WA+) Application in Vietnam’s Ca River Basin. FAO Water Reports. http://www.wateraccounting.org/files/White_Paper_Water_Accounting_Winrock.pdf .
Biancamaria, Sylvain, Dennis P. Lettenmaier, and Tamlin M. Pavelsky. 2016. “The SWOT Mission and Its Capabilities for Land Hydrology.” In Remote Sensing and Water Resources, 117–47. Cham: Springer International Publishing.
Central Ground Water Board. 2021. National Compilation on Dynamic Ground Water Resources of India, 2020. New Delhi: Ministry of Jal Shakti, Government of India.
Deggim, Simon, Annette Eicker, Lennart Schawohl, Helena Gerdener, Kerstin Schulze, Olga Engels, Jürgen Kusche, et al. 2020. “RECOG RL01: Correcting GRACE Total Water Storage Estimates for Global Lakes/Reservoirs and Earthquakes.” Earth System Science Data Discussions (2020): 1–30.
Food and Agriculture Organization of the United Nations (FAO). 2012. Systematic Approach to Water Auditing: Guidelines for Water Managers. Rome: FAO. https://www.fao.org/land-water/water/water-management/water-accounting/….
Food and Agriculture Organization of the United Nations (FAO). 2016. AQUASTAT Water Accounting and Water Audit: Conceptual Framework. Rome: FAO. https://www.fao.org/aquastat/en/.
Food and Agriculture Organization of the United Nations (FAO). 2020. WaPOR Database. Rome: FAO. https://www.fao.org/land-water/databases-and-software/wapor/en/.
Food and Agriculture Organization of the United Nations, Land & Water Division. n.d. “Water Accounting and Auditing.” Accessed October 30, 2025. https://www.fao.org/land-water/water/water-accounting-auditing.
Georgia Environmental Protection Division. 2020. Qualified Water Loss Auditor (QWLA) Program. Atlanta: Georgia Environmental Protection Division. https://epd.georgia.gov/water-loss-audits.
Global Water Partnership. 2012. Integrated Water Resources Management Toolbox: Water Auditing and Accounting. Stockholm: Global Water Partnership. https://www.unccd.int/land-and-life/drought/toolbox/risk-mitigation-mea….
Healy, Richard W., and Brian R. Scanlon. 2010. Estimating Groundwater Recharge. Cambridge: Cambridge University Press. https://doi.org/10.1017/CBO9780511780745.
Karimi, Pejman, and W. G. M. Bastiaanssen. 2015. “Spatial Evapotranspiration, Rainfall and Land Use Data in Water Accounting — Part 1: Review of the Accuracy of the Remote Sensing Data.” Hydrology and Earth System Sciences 19: 507–32. https://hess.copernicus.org/articles/19/507/2015/.
Karimi, Pejman, W. G. M. Bastiaanssen, and David Molden. 2013. “Water Accounting Plus (WA+) — A Water Accounting Procedure for Complex River Basins Based on Satellite Measurements.” Hydrology and Earth System Sciences 17: 2459–74. https://doi.org/10.5194/hess-17-2459-2013.
Liu, Xiaodan, Brian R. Scanlon, and James S. Famiglietti. 2022. “Groundwater Depletion in California’s Central Valley Accelerates during Megadrought.” Nature Communications 13: 7133. https://www.nature.com/articles/s41467-022-35582-x .
McCabe, Matthew F., Matthew Rodell, Douglas E. Alsdorf, Diego G. Miralles, Remko Uijlenhoet, Wolfgang Wagner, Arko Lucieer, et al. 2017. “The Future of Earth Observation in Hydrology.” Hydrology and Earth System Sciences 21, no. 7: 3879–3914.
Molden, David. 1997. Accounting for Water Use and Productivity. Colombo: International Irrigation Management Institute.
Maven’s Notebook. n.d. “Water Budget Framework Concept and Flow.” Accessed October 30, 2025. Adapted from California Department of Water Resources, Water Budget Framework.
NASA Jet Propulsion Laboratory; California Institute of Technology; University of Texas Center for Space Research. 2013. “GRACE Measures Groundwater Changes Across the U.S.” Data map. Pasadena, CA: NASA Jet Propulsion Laboratory. Accessed October 30, 2025. https://www.jpl.nasa.gov/images/pia16840-grace-measures-groundwater-cha… /.
NASA. 2023. “OpenET Launches a New API.” News release, October 3, 2023. https://www.nasa.gov/general/openet-launches-a-new-api/.
NASA Jet Propulsion Laboratory. n.d. “GRACE and GRACE‑FO Track California’s Land Water Changes.” NASA JPL. https://grace.jpl.nasa.gov/resources/42/grace-and-grace-fo-track-califo… .
Niranjannaik, P., S. Kumar, and P. S. Rao. 2022. “Groundwater Variability in a Semi‑Arid River Basin, Central India.” Hydrology 9, no. 12: 222. https://doi.org/10.3390/hydrology9120222.
Renó, Vivian, Evlyn Novo, and Maria Escada. 2016. “Forest Fragmentation in the Lower Amazon Floodplain: Implications for Biodiversity and Ecosystem Service Provision to Riverine Populations.” Remote Sensing 8, no. 11: 886.
Senay, Gabriel B. 2018. “Satellite Psychrometric Formulation of the Operational Simplified Surface Energy Balance (SSEBop) Model for Quantifying and Mapping Evapotranspiration.” Applied Engineering in Agriculture 34, no. 3: 555–66. https://doi.org/10.13031/aea.12614 .
Sheffield, Justin, Eric F. Wood, Ming Pan, Hylke E. Beck, Giulia Coccia, A. Serrat‑Capdevila, and Katrien Verbist. 2018. “Satellite Remote Sensing for Water Resources Management: Potential for Supporting Sustainable Development in Data‑Poor Regions.” Water Resources Research (published October 29, 2018). https://doi.org/10.1029/2017WR022437 .
Singh, R. B., Iqbal Haque, and Dinesh Kumar. 2016. The Ganges River Basin: Status and Challenges in Water, Environment and Livelihoods. Abingdon: Routledge.
SDGs Partnership. n.d. “Global Monitoring of Actual Evapotranspiration, Biomass Production, and Water Productivity.” SDGs Partnership. https://sdgs.un.org/partnerships/global-monitoring-actual-evapotranspir….
Tran, T. A., V. H. Nguyen, and Q. T. Vo. 2024. “Hydrosocial Ruptures and Livelihood Transformations in the Vietnamese Mekong Floodplain.” Environmental Science & Policy. https://pubmed.ncbi.nlm.nih.gov/40274696/.
UNESCO. 2021. World Water Development Report 2021: Valuing Water. Paris: United Nations Educational, Scientific and Cultural Organization. https://www.unwater.org/publications/un-world-water-development-report-… .
UNESCO. 2024. World Water Assessment Programme: Water for Prosperity and Peace. Paris: United Nations Educational, Scientific and Cultural Organization. https://www.unesco.org/en/wwap.
UNESCO Publishing. 2023. United Nations World Water Development Report 2023: Partnerships and Cooperation for Water. Paris: UNESCO Publishing. https://www.unwater.org/publications/un-world-water-development-report-….
UNESCO‑IHE Institute for Water Education. n.d. Water Accounting Framework. Delft: UNESCO‑IHE Institute for Water Education. Accessed October 30, 2025. https://wateraccounting.un-ihe.org/en/wa-framework.
United Nations. 2015. Transforming Our World: The 2030 Agenda for Sustainable Development. New York: United Nations. https://sdgs.un.org/2030agenda .
United Nations Framework Convention on Climate Change (UNFCCC). 2015. The Paris Agreement. Bonn: UNFCCC. https://unfccc.int/process-and-meetings/the-paris-agreement.
United Nations Statistics Division. 2012. System of Environmental‑Economic Accounting for Water (SEEA‑Water). New York: United Nations. https://unstats.un.org/unsd/envaccounting/seeaRev/SEEA_CF_Final_en.pdf.
Van Dijk, Albert I. J. M., Jaap Schellekens, Marta Yebra, Hylke E. Beck, Luigi J. Renzullo, Albrecht Weerts, and Gennadii Donchyts. 2018. “Global 5 km Resolution Estimates of Secondary Evaporation Including Irrigation through Satellite Data Assimilation.” Hydrology and Earth System Sciences 22, no. 9: 4959–80.
Water Efficiency Alliance. 2021. Water Audit and Efficiency Best Practices Guide. Sacramento: California Water Efficiency Partnership. https://calwep.org/.
Water Research Foundation. 2016. Level 1 Water Audit Validation Guidance Manual (Project No. 4639A). Denver: Water Research Foundation. https://www.waterrf.org/research/projects/level-1-water-audit-validatio… .
World Health Organization and partners (SDGs Partnership). n.d. “Global Monitoring of Actual Evapotranspiration, Biomass Production, and Water Productivity.” SDGs Partnership. https://sdgs.un.org/partnerships/global-monitoring-actual-evapotranspir….