Digital Elevation Model (DEM)

"A representation of the topography of the Earth in digital format, that is, by coordinates and numerical descriptions of altitude." (National Aeronautics and Space Administration, 2017)

Examples for open source DEMs are Space Shuttle Radar Topography Mission (SRTM), ASTER Global Digital Elevation Model, JAXA’s Global ALOS 3D World (GISGeography.com, 2018)

Sources

"Glossary". Earth Observatory, National Aeronautics and Space Administration. Last modified August 4, 2017.
https://www.earthobservatory.nasa.gov/glossary/all.
Accessed February 14, 2019.
“5 Free Global DEM Data Sources – Digital Elevation Models”. GISGeography, GISGeography.com. Last modified February 21, 2018.
https://gisgeography.com/free-global-dem-data-sources/.
Accessed April 1, 2019.

Related Content

Capacity Building and Training Material

ARSET - River basin delineation based on NASA digital elevation data

Overview:

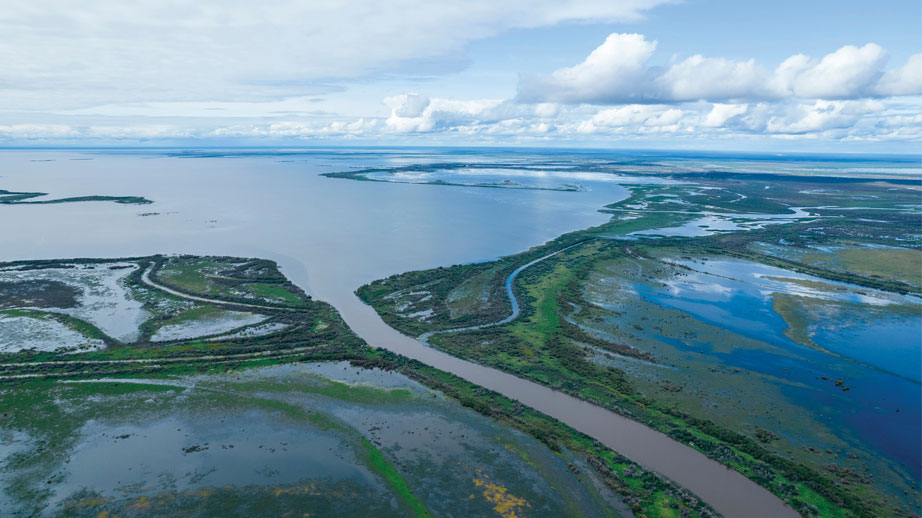
River basins (known as watersheds in North America) are areas of land that drain precipitation, surface water, and underlying groundwater into a river and its tributaries, eventually reaching a common outlet such as a lake, reservoir, river, or estuary. The drainage pattern is from smaller sub-basin to larger sub-basin, and from higher elevation to lower elevation. Land surface processes, precipitation, storm water, and wastewater runoff within basins have substantial impact on quantity and quality of the water draining into tributaries.

Local Perspectives Case Studies

Space-based Solution

Addressed challenge(s)

The extraction of information on groundwater for a geographically small, water-scarce and groundwater reliant region

Collaborating actors (stakeholders, professionals, young professionals or Indigenous voices)
Suggested solution

Solution summary

To address the challenge of water security in Bahrain, this solution integrates space-based technologies and geospatial analysis to identify and monitor potential water resources, particularly shallow groundwater. The methodology involves the use of satellite-derived datasets and terrain modelling tools to analyse hydrological behaviour, soil moisture, and elevation-based drainage characteristics.

Three main data sources were incorporated into the solution:

  1. GRACE (Gravity Recovery and Climate Experiment) data is used to assess changes in terrestrial water storage at the regional scale by detecting gravity anomalies related to mass variations in groundwater. GRACE data is retrieved and visualised through platforms such as Google Earth Engine and ArcGIS Pro, enabling temporal monitoring of water resources.
     
  2. HAND (Height Above Nearest Drainage) modelling was employed to identify topographic wetness and assess the hydrological potential of the landscape. HAND normalises elevation relative to the nearest drainage, highlighting areas where water is more likely to accumulate or infiltrate. This method supports the identification of suitable zones for groundwater recharge, such as infiltration basins or artificial wetlands, especially in an arid environment like Bahrain. The HAND model was derived using the GLO-30 Copernicus DEM (2023_1 DGED version), processed through the TerraHidro platform, and included the generation of essential layers such as flow direction (D8), contributing area (D8CA), slope, and drainage networks with thresholds of 10, 100, and 300 pixels.
     
  3. Soil moisture analysis was conducted using two approaches:
  • SAR (Synthetic Aperture Radar) data from the Sentinel-1 constellation, which provides all-weather, day-and-night measurements of surface moisture conditions.
  • Optical-based soil moisture estimation, calculated from Landsat-8 imagery using vegetation and thermal indices (e.g., Normalized Difference Vegetation Index (NDVI), Land Surface Temperature (LST)). This dual approach allows for consistent monitoring of surface moisture, which is crucial for assessing recharge potential and supporting irrigation planning.

Together, these tools provide a multi-faceted view of Bahrain's hydrological landscape, enabling decision-makers to strategically identify areas with groundwater potential and implement more sustainable water resource management practices.

Solution requirements

Gravity Recovery and Climate Experiment (GRACE)

GRACE is a joint mission by the National Aeronautics and Space Administration (NASA) and the German Aerospace Center (DLR) to measure Earth's gravity field anomalies from its launch in March 2002 to the end of its mission in October 2017. The GRACE Follow-On (GRACE-FO) is a continuation of the mission launched in May 2018. GRACE provides information on how mass is distributed and is varied over time through its detection of gravity anomalies. Because of this, a significant application of GRACE is groundwater anomalies detection. Hence, GRACE data has been explored as a solution for this challenge.

Two software platforms have been utilised to download and visualise GRACE data for Bahrain:

  1. Google Earth Engine (GEE): A cloud-based platform that facilitates remote sensing analysis with a large catalogue of satellite imagery and geospatial datasets. The platform is free for academic and research purposes.
     
  2. QGIS: A desktop application that allows the exploration, analysis and visualisation of geospatial data. This application is open source.

Height Above Nearest Drainage (HAND)

The Height Above Nearest Drainage (HAND) is a terrain model that normalises elevation data relative to the local drainage network, offering a hydrologically meaningful representation of the landscape. By calculating the vertical distance between each point on the terrain and the nearest drainage channel, HAND allows for the identification of topographic wetness zones and the classification of soil water environments. It has shown strong correlation with water table depth and has been effectively validated in various catchments, particularly in the Amazon region. The HAND model supports physically based hydrological modelling and has broad applicability in areas such as flood risk assessment, soil moisture mapping, and groundwater dynamics, using only remote sensing-derived topographic data as input.

Soil moisture using Synthetic Aperture Radar (SAR) imagery

SAR data from Sentinel-1 constellation was used to generate relative soil moisture values. Seninel-1 is a radar-based satellite which acquires data with 6 days repeat cycle, and is neither affected by clouds, weather nor time of the day. Being a dual-polarimetric platform, it acquires data in VV (Vertical-transmit and Vertical received) polarization and VH (Vertical-transmit and Horizontal received) polarization. The data was analysed in GEE.

Soil moisture using multispectral and thermal imagery (Optical)

The data utilised to detect soil moisture are satellite imagery from Landsat-8 downloaded through GEE. Landsat-8 provides multispectral and thermal satellite imagery with 16 days repeat cycle. The specific bands required to calculate soil moisture index are the red, near-infrared bands and thermal infrared bands.

Solution outline and steps

GRACE

Figure 1 illustrates the steps taken to extract the recent GRACE Monthly Mass Grids Version 04 - Global Mascon (CRI Filtered) Dataset from GEE.


Steps to download GRACE satellite data
Figure 1. Download steps for GRACE Data


HAND

The elevation data downloaded and processed for the region of interest were derived from the GLO-30 dataset. The Copernicus DEM, a Digital Surface Model (DSM), represents the Earth's surface, including features such as buildings, vegetation, and infrastructure. This DSM is based on the WorldDEM product, which has undergone extensive editing to ensure the flattening of water bodies, consistent river flow representation, and correction of terrain anomalies, including shorelines, coastlines, and features like airports. The WorldDEM itself was generated using radar satellite data from the TanDEM-X mission, a Public Private Partnership between the German Aerospace Centre (DLR) and Airbus Defence and Space. The GLO-30 data used in this work corresponds to the 2023_1 version of the Defence Gridded Elevation Data (DGED), provided via ESA’s https PRISM service and made accessible through OpenTopography.

The following products were processed using the TerraHidro software from the GLO-30 dataset: removepits.tif, d8.tif, d8ca.tif, slope.tif, drainage_10.tif, drainage_100.tif, and drainage_300.tif, as well as the HAND-derived products hand_10.tif, hand_100.tif, and hand_300.tif. Each product has a specific role in hydrological modeling:

  • removepits: This process modifies the original Digital Elevation Model (DEM) to eliminate depressions or pits that are not hydrologically realistic, ensuring that every cell has a defined downstream flow direction.
  • d8: The D8 (Deterministic 8) flow direction model calculates the steepest descent path from each pixel to one of its eight neighbors, indicating the primary direction of surface water flow.
  • d8ca: The D8 Contributing Area represents the number of upstream cells that contribute flow to each cell, allowing the identification of areas of potential accumulation and drainage.
  • slope: This product calculates the slope of the terrain in degrees, essential for understanding runoff velocity and erosion potential.
  • drainage_10, drainage_100, and drainage_300: These are drainage networks derived from the D8 contributing area, using threshold values of 10, 100, and 300 pixels, 0.9ha, 9ha and 27ha, respectively. They represent streams formed when the contributing area exceeds the specified number of pixels, with higher thresholds resulting in more generalised drainage networks.

From these products, the following HAND (Height Above Nearest Drainage) models were generated:

  • hand_10, hand_100, and hand_300: These datasets represent the vertical distance (in meters) from each pixel to the nearest drainage cell identified in the corresponding drainage network (with thresholds of 10, 100, and 300 pixels, respectively). These HAND maps are used to characterise terrain wetness, identify flood-prone areas, and support soil moisture and hydrological modeling.

All processing followed the methodology and toolset provided by the TerraHidro system, developed by INPE, and detailed at http://www.dpi.inpe.br/terrahidro/doku.php.

Soil moisture (SAR)

Several steps were executed to derive the mean soil moisture conditions over the study area between 2017 and 2024. A step-by-step guide is shown in Figure 2. The values of soil moisture estimated is relative to the maximum soil moisture recorded in the region such that the wettest will be the maximum and the driest will be the minimum.  These are used to normalise the final output into values between 0 and 1 where 0 is the driest and 1 is the wettest.

Steps for processing SAR soil moisture
Figure 2. Processing steps for SAR soil moisture


Soil moisture (Optical)

Similar to the soil moisture calculation with SAR, an average of the soil moisture from 2017 to 2024 has been derived. The interrelations between the derived vegetation through the Normalized Difference Vegetation Index (NDVI) as well as Land Surface Temperature (LST) have been the basis for generating the soil moisture map. Figure 3 demonstrates the steps followed to generate optical soil moisture.

Steps for processing optical soil moisture
Figure 3. Processing steps for optical soil moisture


Shallow groundwater locations/recharge areas

To estimate potential suitable locations for shallow groundwater or groundwater rechange, the results from the HAND, SAR and optical soil moisture have been aggregated to formulate a final classification map. To perform this, the following has been done:

  1. Classification of HAND, SAR and optical soil moisture results to ranges from 1-5, with 5 being the most suitable region based on the related values.
  2. Spatial modelling of these three classifications to formulate a final suitability value from 1-5 with 5 being the most suitable region overall. HAND has been given a weightage of 50 per cent while SAR and optical soil moisture have been given a weightage of 25 per cent each to represent 50 per cent overall for soil moisture.

Map generation

Different maps have been generated for each component of this solution (HAND, SAR soil moisture, optical soil moisture, shallow groundwater locations/recharge areas). The subsequent steps illustrate the steps needed to develop the maps for this solution:

  1. A basemap is added to the map for visualisation purposes. This is done through using the QGIS plugin called QuickMapServices. To install plugins, go to the Plugins tab and select Manage and Install Plugins.
Installing plugins in QGIS
Figure 4. Map generation - Step 1


  1. In the search box of the Plugins window, search for QuickMapServices and install the plugin.
QGIS plugin QuickMapServices
Figure 5. Map generation - Step 2


  1. The plugin logo should appear in the QGIS panel. Click on the logo for Search QMS Panel. This label would appear if you hovered over the logo.
Finding plugin in QGIS panel
Figure 6. Map generation - Step 3


  1. In the Search QMS Panel on the right, search for Google Satellite and add the basemap. It should appear in the list of layers.
Adding a basemap with the QGIS plugin
Figure 7. Map generation - Step 4


  1. Now we have a base layer that we can place our analysis on top of. Add the layer to the QGIS project if it is not already added. This can be done through drag and drop.
Adding a layer to QGIS project
Figure 8. Map generation - Step 5


  1. Right click on the layer and select Properties to adjust visualisation parameters.
Adjusting parameters in Properties of layer in QGIS
Figure 9. Map generation - Step 6


  1. In the Layer Properties window, click on Symbology and discover the most appropriate visualisation method for the data layer. This is an example for the set classifications for the HAND.
Adjusting symbology of a layer in QGIS
Figure 10. Map generation - Step 7


  1. Once the layer visualisation has been set, the map layout can be generated. Go to Project > New Print Layout and name the layout.
Creating a new print layout in QGIS
Figure 11. Map generation - Step 8


Naming the print layout in QGIS
Figure 12. Map generation - Step 8


  1. In the Layout window, items such as the layers map, legend, scales can be added. This is accessed through the Add Item tab.
Adding items to print layout in QGIS
Figure 13. Map generation - Step 9


  1. The items added to the map can then be moved and arranged by selecting the Edit tab then either Select/Move Content to move the locations of the specific content or Move Content to move the position/scale of the map.
Moving and scaling the map in the print layout in QGIS
Figure 14. Map generation - Step 10


  1. Each item’s properties such as size, colour and fonts can also be edited in the Item Properties panel in the right.
Adjusting the properties of an item in the print layout in QGIS
Figure 15. Map generation - Step 11


  1. The final generated layout is then exported in the desired format: png, pdf or svg. This is achieved through clicking on the Layout tab.
Exporting the print layout in QGIS
Figure 16. Map generation - Step 12


Results and maps

GRACE

The GRACE data has been downloaded and analysed through GEE. The main limitation of this dataset is its course resolution of 55.6 km2 as downloaded from the platform. This is due to the small geographical area of Bahrain at around 800 km2, causing water storage monitoring in specific locations to be a difficult task. Figure 17 demonstrates the span of GRACE data relative to the area of Bahrain.

GRACE data monthly grids for Bahrain
Figure 17.GRACE Mascon- 2002 to 2024 Bahrain


HAND

The HAND model shown in the figure 18 provides valuable insights for addressing water scarcity in Bahrain. The low-lying areas highlighted in blue indicate regions where water tends to accumulate or water table is relatively shallow, suggesting potential zones for managed aquifer recharge (MAR) or stormwater harvesting. These areas could be prioritised for infiltration basins, recharging wells, or constructed wetlands to enhance groundwater storage. Conversely, the higher elevation zones in grey are less likely to retain surface water but could be strategically used for runoff collection and diversion to recharge areas. Given Bahrain’s arid climate and dependence on non-conventional water sources, integrating HAND-based terrain analysis into water resource planning can support more resilient, localised, and efficient water management strategies, particularly in optimising land use for recharge, storage, and flood mitigation purposes.

Map with results for HAND at 100m threshold
Figure 18. HAND results map


Soil moisture (SAR)

Figure 19 shows the mean soil moisture values of different regions of Bahrain. The southern regions seem to be drier while most central regions are wet. The analysis excluded urban regions.

Map with SAR soil moisture results
Figure 19. SAR soil moisture results map


Soil moisture (Optical)

Figure 20 illustrates the soil moisture map with optical imagery for Bahrain. The results here highlight the northern west regions with high soil moisture values and the central, southern regions as dry with some specific location in the central and southern regions as wet.

Map with optical soil moisture results
Figure 20. Optical soil moisture results map


Shallow groundwater locations/recharge areas

Through Figure 5, the combinations of HAND, SAR and optical soil moisture has yielded to the potential locations for shallow groundwater locations/recharge areas. The areas highlighted in red represent the locations with highest potential.

Map showing potential shallow groundwater locations and recharge areas in Bahrain
Figure 21. Shallow groundwater locations/recharge areas results map


Solution impact

With the establishment of a methodology that identifies locations of shallow groundwater or recharge, significant information is being derived about the hydrological state of the country. This importance is placed due to the lack of remote sensing data that enables direct measurement of groundwater in the area. Hence the information extracted from this methodology can be initially integrated with sample in-situ data to calibrate the model; and then, be relied on solely for future measurements. Additionally, with the country’s rigorous focus on addressing groundwater scarcity, this type of information can greatly support decision-making when it comes to the formulation and execution of different projects and policies related to this matter.

Future work

To enhance the accuracy, applicability, and long-term impact of this solution in addressing water scarcity in Bahrain, several future developments are proposed:

  1. Integration of additional remote sensing products: Incorporate higher-resolution satellite data to improve spatial resolution in soil moisture and elevation analyses, enabling finer-scale hydrological modeling and more localised identification of recharge zones. Moreover, the inclusion of land cover and geological characteristics can enhance the spatial modelling conducted.
     
  2. Validation with in-situ data: Collaborate with local water authorities to collect and integrate ground-truth data such as groundwater levels, soil profiles, and well yields to validate and calibrate the HAND model and soil moisture outputs. This is also vital to assess the suitable weightage and classification for spatial modelling to be done to combine all three products generated.
     
  3. Development of a Decision Support System (DSS): Create an interactive platform or dashboard that integrates HAND, GRACE, and soil moisture maps to assist policymakers in identifying priority areas for groundwater recharge, stormwater harvesting, and drought preparedness.
     
  4. Temporal analysis and trend monitoring: Implement time-series analyses of GRACE and soil moisture data to detect trends, seasonal variations, and anomalies in water availability, supporting early warning systems and long-term planning.
     
  5. Hydrological modelling coupling: Link HAND-derived terrain data with physically based hydrological models (e.g., SWAT, DHSVM) to simulate runoff, infiltration, and recharge scenarios under different land use and climate conditions.
     
  6. Community engagement and capacity building: Conduct training workshops and knowledge-sharing activities with national institutions and stakeholders to build local capacity in geospatial water resource monitoring using open-source and space-based tools.

By pursuing these developments, the solution can evolve into a comprehensive and replicable model for sustainable groundwater resource management in water-scarce regions worldwide.

Relevant publications
Related space-based solutions
Sources

Nobre, A. D., Cuartas, L. A., Hodnett, M., Rennó, C. D., Rodrigues, G., Silveira, A., Waterloo, M., & Saleska, S. “Height Above the Nearest Drainage – a hydrologically relevant new terrain model.” Journal of Hydrology 404, no. 1–2 (2011): 13–29. https://doi.org/10.1016/j.jhydrol.2011.03.051.

Keywords (for the solution)
Climate Zone (addressed by the solution)
Habitat (addressed by the solution)
Region/Country (the solution was designed for, if any)
Relevant SDGs