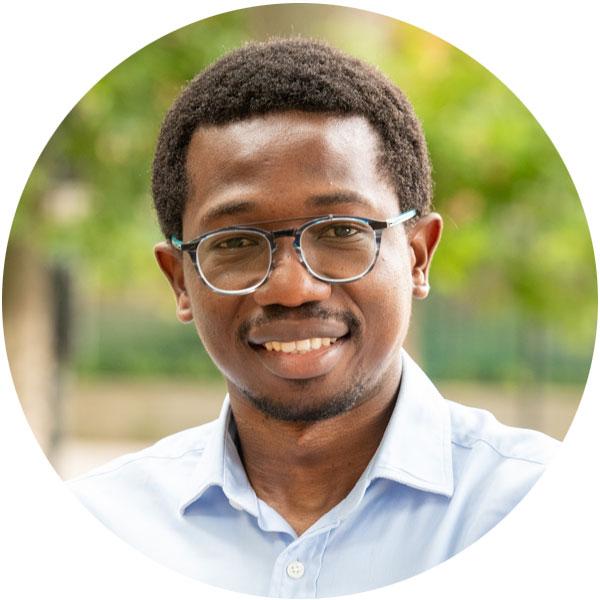
To establish an integrated monitoring and decision-support system that uses Earth Observation data and machine learning to track the status of Lake Ol' Bolossat, enabling evidence-based conservation and sustainable development actions.
Requirements
Data
Below is a table showing the data requirements and sources.
Data source | Use case | Period |
---|---|---|
JRC GSW | Historical water extents | 1984 - 2023 |
Sentinel-1 SAR | Water extent during cloud-cover seasons | 2014 - present |
Sentinel-2 2 MSI | Habitat classification, NDVI, MNDWI, NDBI | 2015 - present |
MODIS | NDVI/ET anomalies and drought indicators | 2000 - present |
Rainfall and climate (CHIRPS/ERA5) | Climate trend correlation with hydrological changes | 1984 - present |
Population/Human settlement (WorldPop, GHSL) | Land use pressure mapping | 2000 - present |
Field surveys and local NGO data | Validation and community-level observations | As available |
Software
The analysis is being done using open-source platforms and software: Google Earth Engine and QGIS.
To access Google Earth Engine, one needs a Google account that will be linked to the platform link. If you are new to the platform, create an account, and you can start using it. If you already have an account, just sign in and be directed to the code editor. If you are new to the software, you can access the training manual here.
To access QGIS, you need to download it as it is a software, link. If you are new to the software, you can access the training manual here.
Physical
- Establishment of Ground Monitoring Stations
- Purpose: To validate satellite data and collect real-time, on-the-ground water level, rainfall, and biodiversity observations.
- Components: Water gauges, weather sensors, camera traps for biodiversity, and simple soil moisture probes.
- Community Information Boards or Digital Kiosks
- Purpose: To display maps, water level trends, and habitat updates to residents in a simplified, accessible format.
- Location: Strategic points around the lake (e.g., near schools, water collection points, community centers).
- Buffer Zone Demarcation and Fencing
- Purpose: To physically protect critical wetland habitats and prevent encroachment or grazing in sensitive areas.
- Details: Fencing or natural barriers like vegetation planting along designated riparian zones.
- Construction of a Local Conservation and Data Hub
- Purpose: To provide a space for community meetings, training sessions, citizen science coordination, and storing field equipment.
- Location: Ideally within a local government or NGO compound near the lake.
- Rehabilitation of Degraded Wetlands
- Purpose: Restore areas where the lakebed or surrounding wetlands have been severely altered.
- Methods: Planting of indigenous wetland vegetation, removal of invasive species, and controlled re-wetting.
- Water Resource Management Infrastructure
- Purpose: To improve the regulation and sustainable use of the lake's water.
- Examples: Controlled inflow/outflow channels, community-led irrigation management systems, water pans for livestock to reduce direct lake access.
- Signage and Protected Area Boundary Markers
- Purpose: To raise awareness of Lake Ol’ Bolossat’s legal protection status and to visually communicate boundaries to land users.
- Materials: Durable signs, educational posters, and protected area plaques.
- Solar-Powered Connectivity Units (Optional but strategic)
- Purpose: For uplinking field sensor data or enabling access to the online dashboard in remote locations.
- Components: Solar panels, GSM routers, rugged tablets or data loggers.
Outline steps for a solution
Phase 1: Planning and Stakeholder Engagement – To do
The first phase involves defining the objectives of the monitoring system and identifying measurable success indicators aligned with conservation priorities and local needs. This is followed by engaging key stakeholders such as the National Environment Management Authority (NEMA), Kenya Wildlife Service (KWS), Water Resources Authority (WRA), Nyandarua County Government, and local community-based organizations. Stakeholder consultations are critical for gathering input on data needs, identifying decision-making gaps, and ensuring buy-in from both policy actors and community leaders. A situational analysis should be conducted to map existing infrastructure, technical capacity, internet access, and human resources available on the ground, helping to identify opportunities and constraints for implementation.
Phase 2: Data Collection and System Design – In progress
In this phase, a comprehensive monitoring framework is developed, specifying the key indicators to be tracked, such as seasonal water extent, land cover transitions, and flood-prone zones. Relevant Earth observation datasets are selected, including Sentinel-1 SAR for water extent, Sentinel-2 for habitat classification, JRC Global Surface Water for historical trends, and CHIRPS for rainfall data. A prototype dashboard is developed using Google Earth Engine, visualizing these datasets through maps, time series graphs, and interactive overlays. Simultaneously, field validation activities are conducted to ground-truth satellite-derived maps. This includes collecting GPS points, photos, and observations on vegetation, land use, and visible signs of degradation, ensuring the remote sensing outputs are accurate and contextually relevant.
Phase 3: System Testing and Expansion – To do
Once the prototype is ready, it is tested with stakeholders through pilot sessions and community workshops. These engagements are used to collect feedback on the dashboard’s usability, relevance, and user experience, particularly for non-technical audiences. Revisions are made to improve clarity, layer toggling, labelling, and interpretability. In parallel, basic physical interventions begin, such as the installation of simple water gauges, informational signboards, and boundary markers for conservation zones. These elements help translate digital insights into tangible tools for the community. Plans for expanding field infrastructure, such as creating buffer zones or establishing a local conservation hub, are also explored during this phase.
Phase 4: Deployment and Knowledge Sharing – In progress
Following successful pilot testing and system refinement, the full monitoring platform is deployed on a publicly accessible hosting environment, such as Firebase, Earth Engine Apps, or a custom-built website. The platform is shared with agencies and conservation partners, accompanied by a rollout plan that includes formal training sessions. These capacity-building workshops are designed to empower users, ranging from government officers to youth groups, with the skills to interpret dashboard outputs and use the data in planning and response. User guides, translated materials, and offline summaries are provided to support long-term usability and local ownership.
Phase 5: Monitoring, Maintenance, and Scaling – To do
The final phase focuses on monitoring the performance and real-world impact of the system. Regular evaluations are conducted to assess usage, data accuracy, stakeholder engagement, and improvements in environmental decision-making. Lessons learned are used to refine system features, add new datasets, and introduce functionalities such as alert notifications or mobile-friendly access. The success of the Lake Ol’ Bolossat solution creates a foundation for scaling to other endangered wetlands across Kenya, such as Lakes Baringo, Naivasha, or Kanyaboli. Finally, the project contributes to the broader Space4Water and open science communities by publishing methods, code, and findings on platforms like GitHub and Earth Engine’s asset repository, ensuring transparency, replicability, and collaboration.
Results
The Lake Ol’ Bolossat monitoring system, currently at prototype stage, holds significant potential to transform how freshwater ecosystems are managed at local and national levels. By integrating satellite-derived water and habitat data into an accessible dashboard, the system aims to bridge the gap between Earth observation science and on-the-ground conservation action. Once implemented with key stakeholders and end users, the following impacts are anticipated:
- Support for Environmental Agencies and County Governments: The system could enhance the capacity of institutions such as the National Environment Management Authority (NEMA), Kenya Wildlife Service (KWS), Water Resources Authority (WRA), and the Nyandarua County Government by providing timely, location-specific data for decision-making on lake and wetland management.
- Early Warning for Hydrological and Ecological Risks: The dashboard could enable stakeholders to detect abnormal patterns in water extent, such as persistent shrinkage or sudden expansion, triggering early intervention to prevent ecological degradation or disaster impacts on nearby communities.
- Community Awareness and Engagement: By visualizing seasonal and long-term changes, the system can be used to build awareness among residents, farmers, and water users around Lake Ol’ Bolossat, empowering them to engage in sustainable practices and to advocate for the protection of the lake.
- Policy-Relevant Monitoring Tool: The platform can serve as a long-term environmental monitoring tool to support the implementation of wetland protection policies, local water catchment strategies, and integrated land use planning frameworks.
- Scalability to Other Freshwater Ecosystems: Once validated, the approach used at Lake Ol’ Bolossat can be adapted to other small inland water bodies across Kenya and East Africa, particularly those facing similar risks of drying, encroachment, or biodiversity loss.
- Alignment with Global and National Development Goals: The system supports Kenya’s contributions to Sustainable Development Goals (SDGs), particularly:
- SDG 6: Ensure availability and sustainable management of water and sanitation
- SDG 13: Take urgent action to combat climate change and its impacts
- SDG 15: Protect, restore and promote sustainable use of terrestrial ecosystems and halt biodiversity loss